Vega-Lite Report Views
What is Vega-Lite?
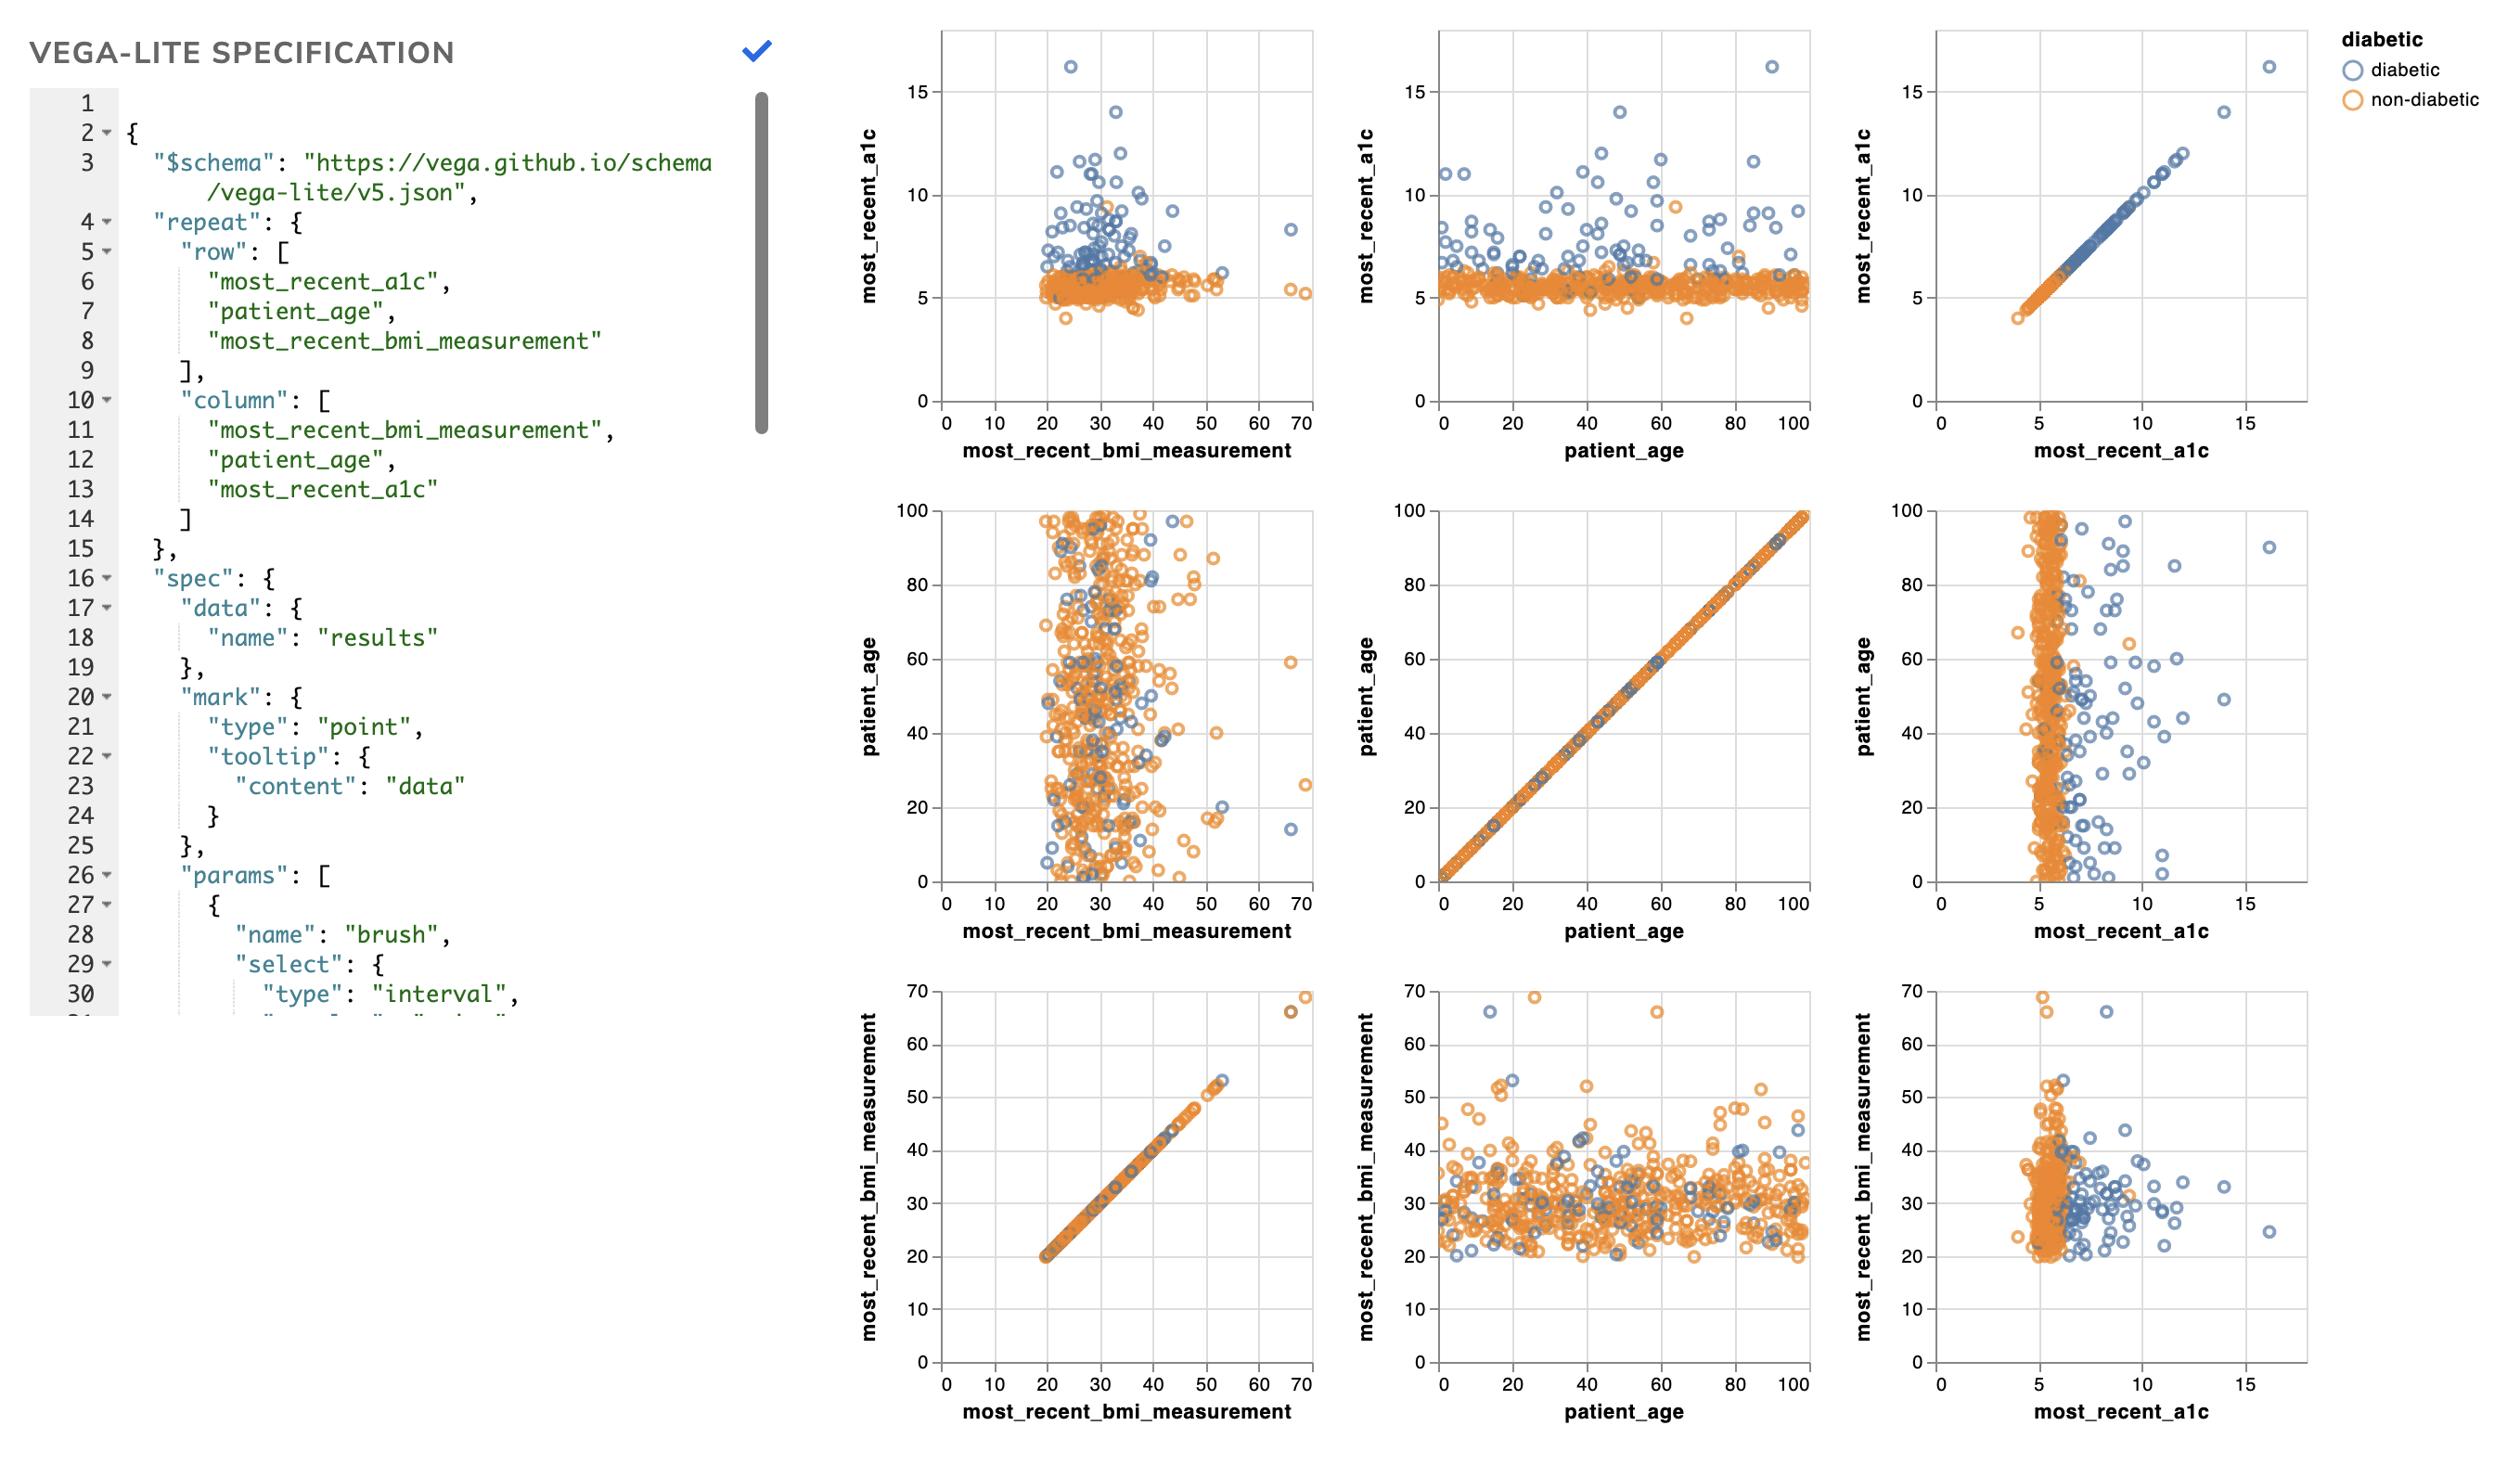
Vega-Lite provides lots of power to create interactive visualizations. It requires some technical know-how and patience to learn. Using JSON, you can describe how data should be visually represented. Vega-Lite calls this a “specification”. You can also include information about data transformations, aggregations, filters, and interactions. Find details about Vega-Lite in this blog post, this talk, or the official documentation on Github.
Here is an example of a Vega-Lite view in Relevant that explores potential patients who have yet to be diagnosed with diabetes:
Using Vega-Lite in Relevant reports
You can add Vega-Lite views on the Edit Report page. Unlike other types of report views, Vega-Lite views can only be configured in advance by report authors when editing a report.

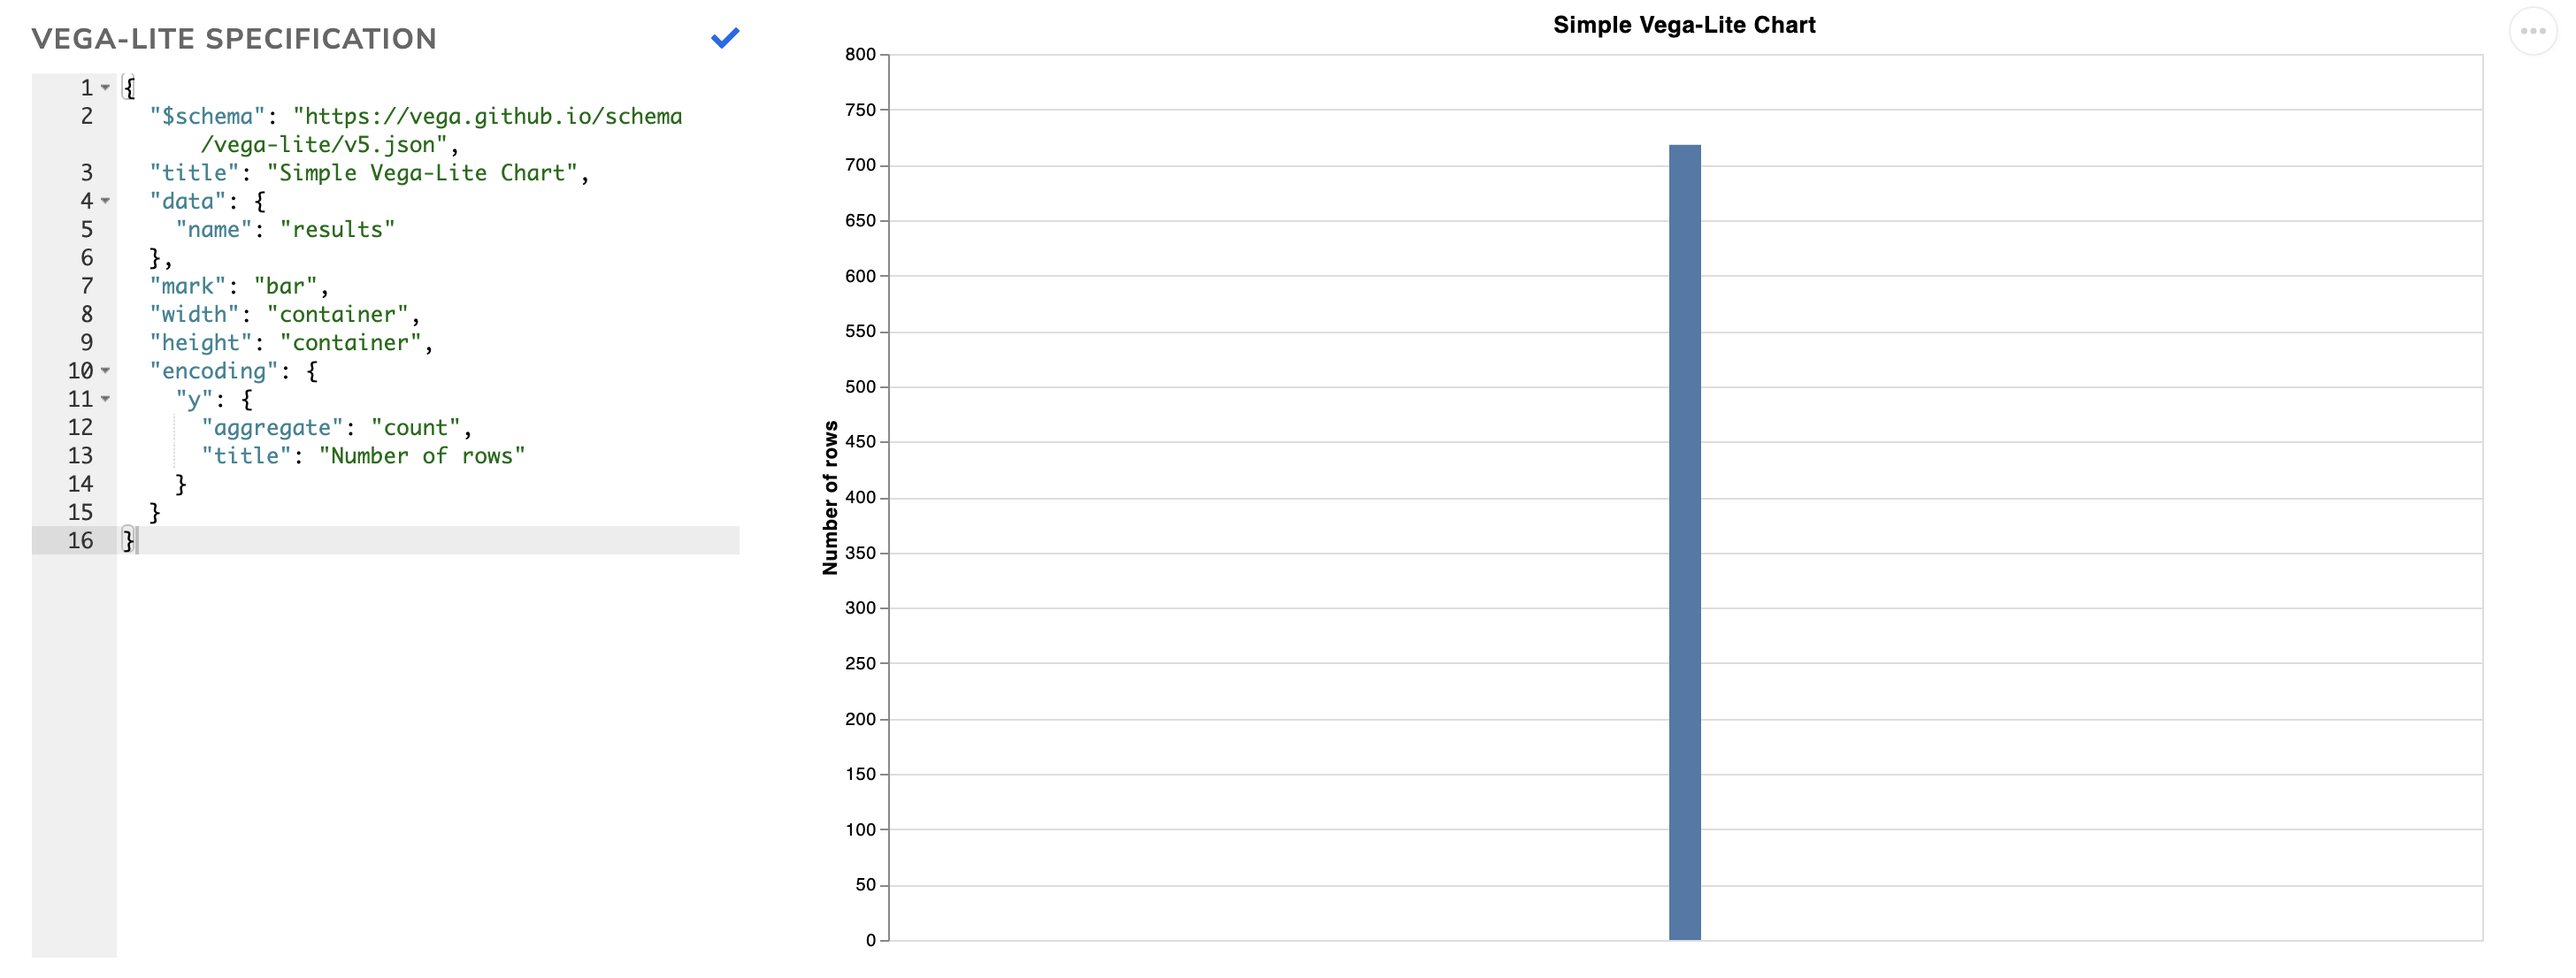
When editing a Vega-Lite report view, you’ll see a Vega-Lite editor on the left and the resulting chart on the right. The chart will update automatically as you make changes to your JSON. By default, you will see a chart showing the count of rows returned by the report’s query and some reasonable default values for the chart width and height.
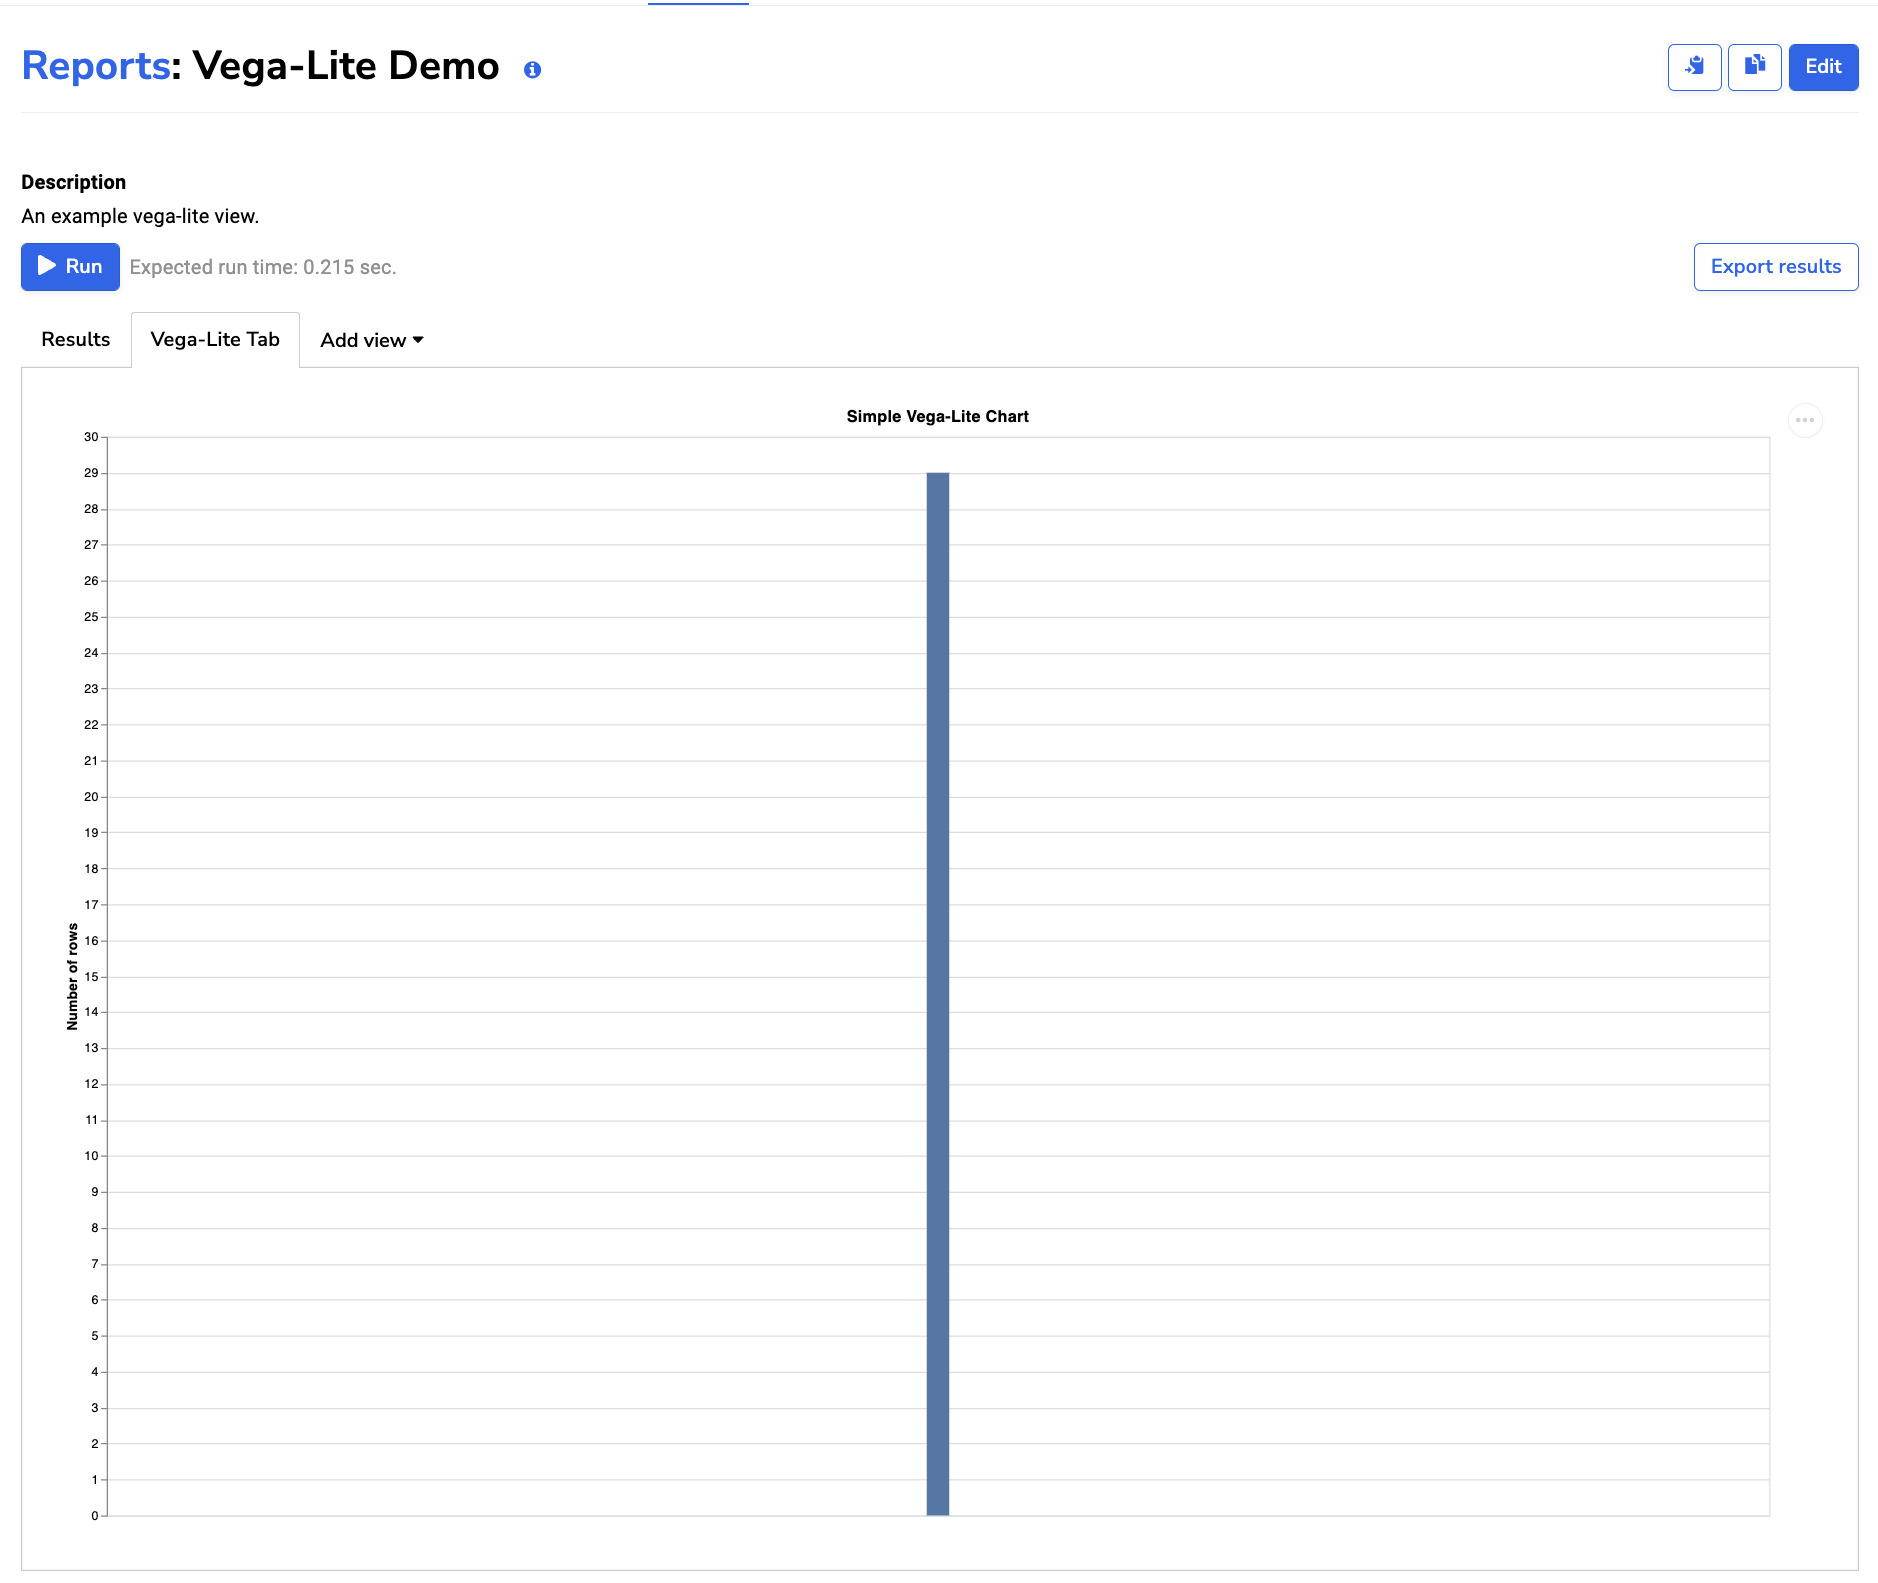
When viewing a report, the Vega-Lite editor is hidden and the chart is automatically resized:
Getting data into Vega-Lite report views: an example
Suppose you have a query that pulls a list of visit locations.
| Report query | Report query results |
|---|---|
<br>SELECT locations.name AS location_name<br>FROM visits<br>LEFT JOIN locations<br>ON visits.location_id = locations.id;<br> | 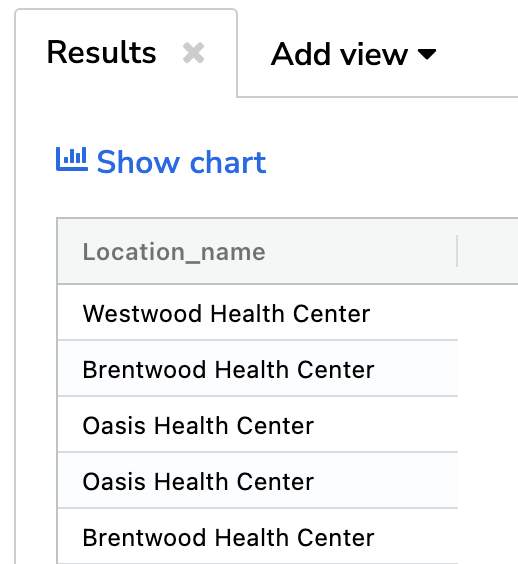 |
The Report Builder represents the results as a list of dictionaries:
{ results: [
    { "location_name": "Westwood Health Center" },
    { "location_name": "Brentwood Health Center" },
    ...
  ]
}
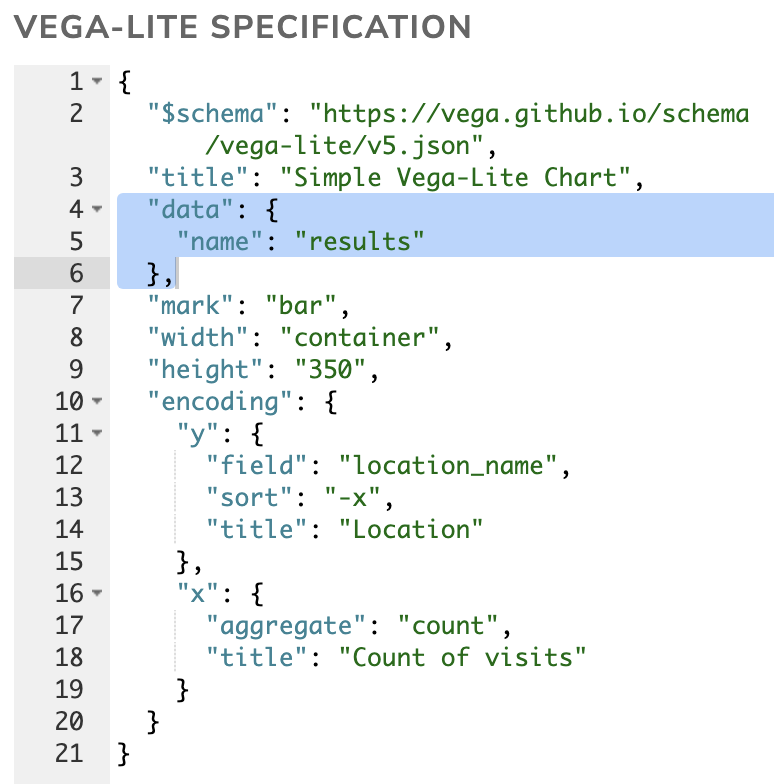
When you add a Vega-Lite report view, it will automatically include the line “data” : { “name”: “results” }, which tells Vega-Lite to look for these results from the Report Builder. This line is required and must not be deleted.
The remainder of the Vega-Lite specification tells Vega-Lite to produce a bar chart.
 | 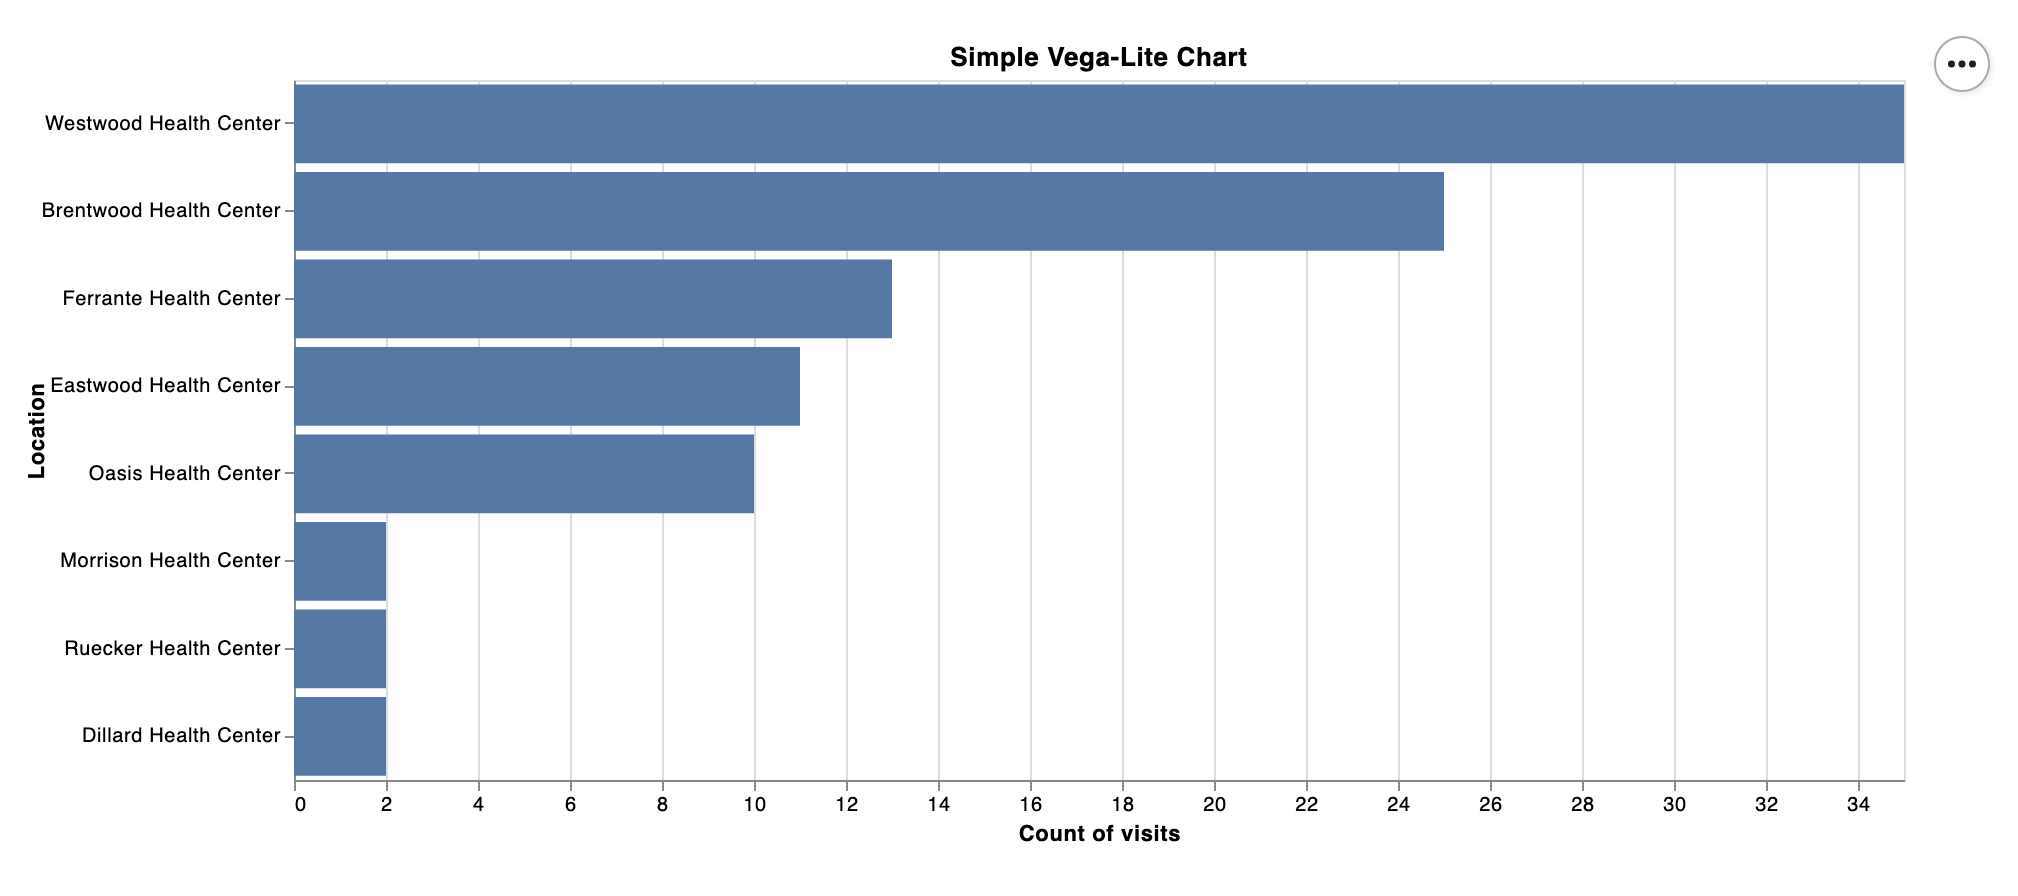 |
To learn more about how to build visualizations using Vega-Lite, check out the resources below.
Resources
- We’ve created a Vega-Lite Cheat Sheet to help you write Vega-Lite code. This is a good place to copy and paste common Vega-Lite code snippets.
-
The Vega-Lite Example Gallery is the best place to look for inspiration and examples that can be modified for your needs.
-
The Online Vega-Editor can be helpful for writing and debugging, however, you must be careful to not bring PHI into it.
- The paper on Vega-Lite describes how it works and relevant design decisions, including how it compiles to the more precise (and much harder to write) Vega.