Vega-Lite Cheat Sheet
Use this cheat sheet as a guide for common Vega-Lite needs. For detailed examples and how-tos, refer to the official Vega-Lite documentation.
Mark
The mark section is where you tell Vega-Lite what type of visualization you’d like to see. You can use these on their own or layer multiple marks to achieve certain visualizations. Here are the different types:
<br>"arc"<br> | 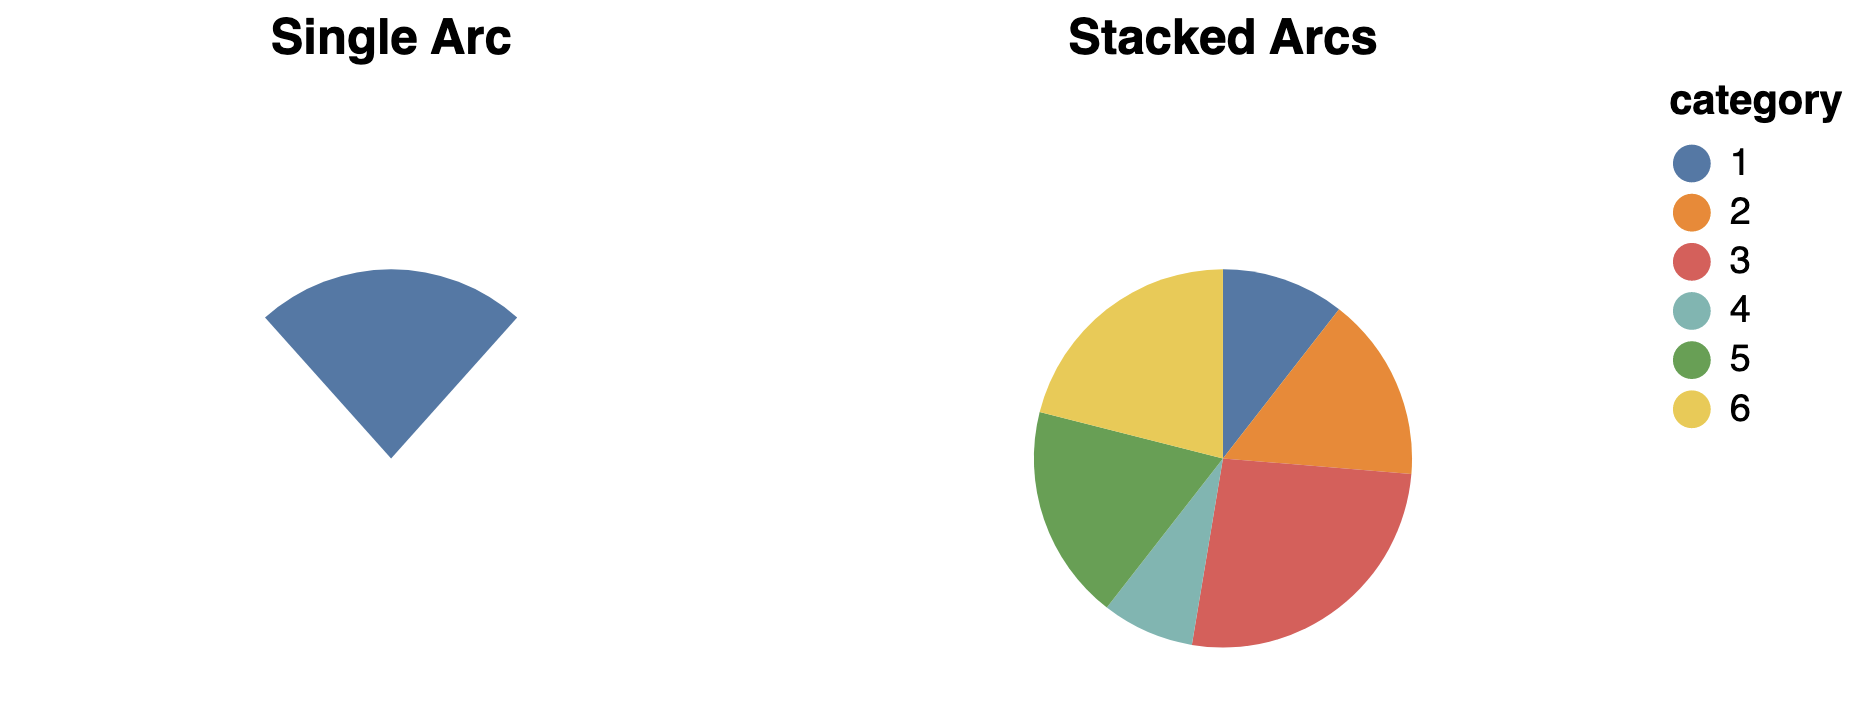 |
<br>"area"<br> | 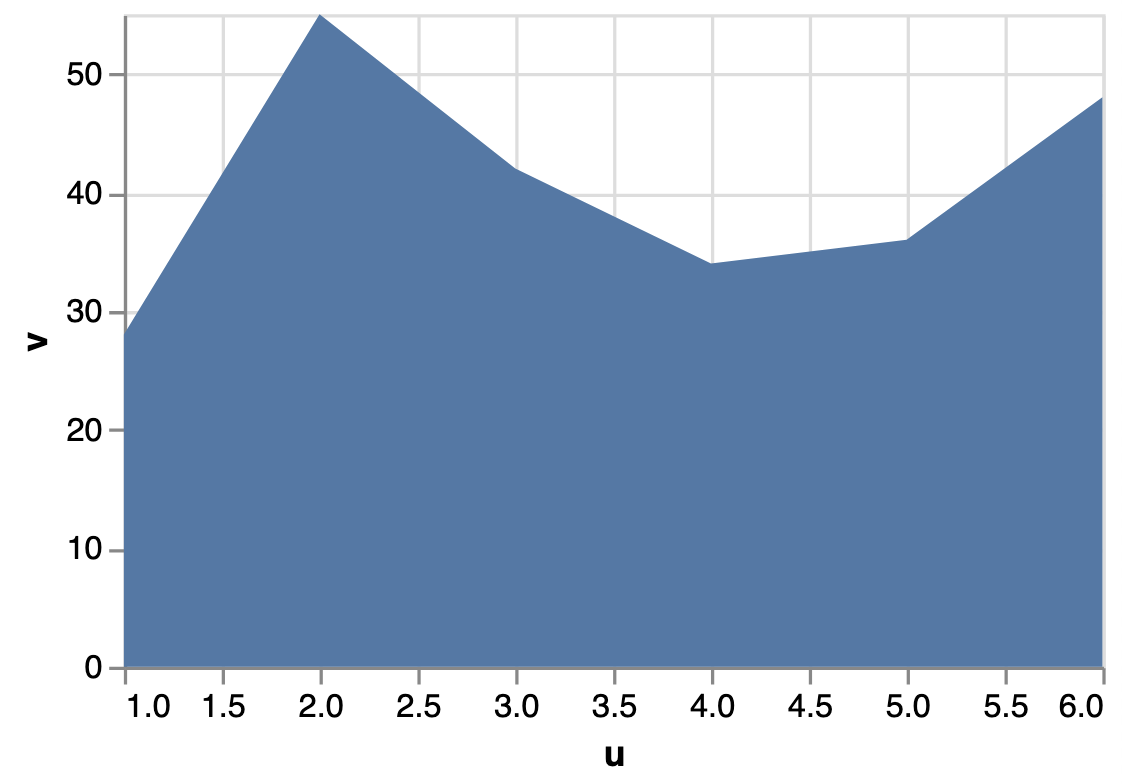 |
<br>"bar"<br> | 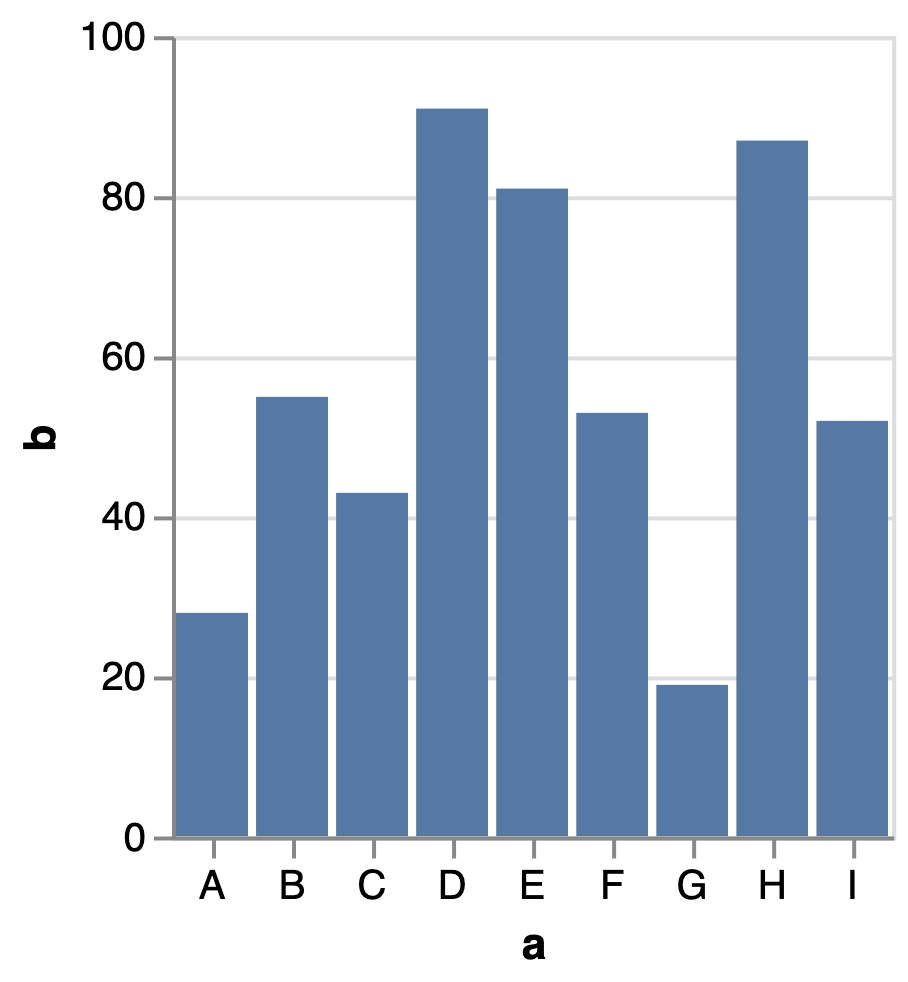 |
<br>"boxplot"<br> | 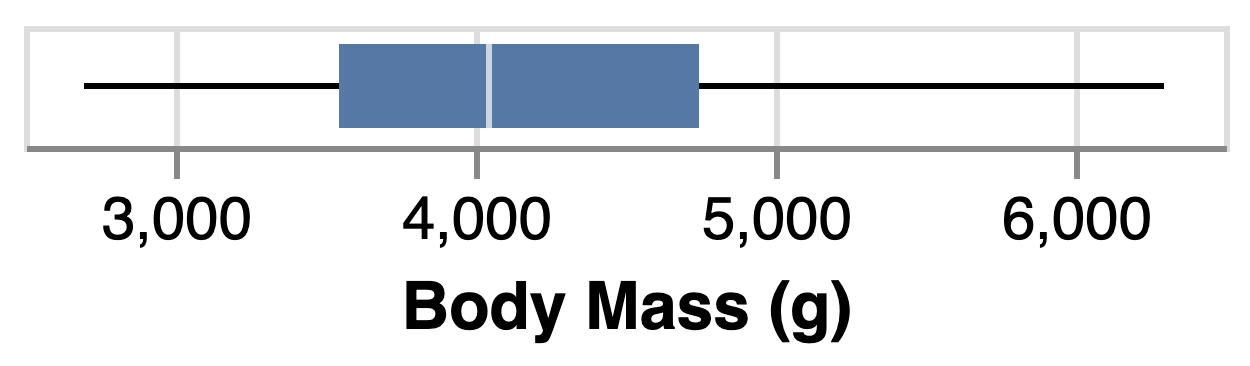 |
<br>"circle"<br> | 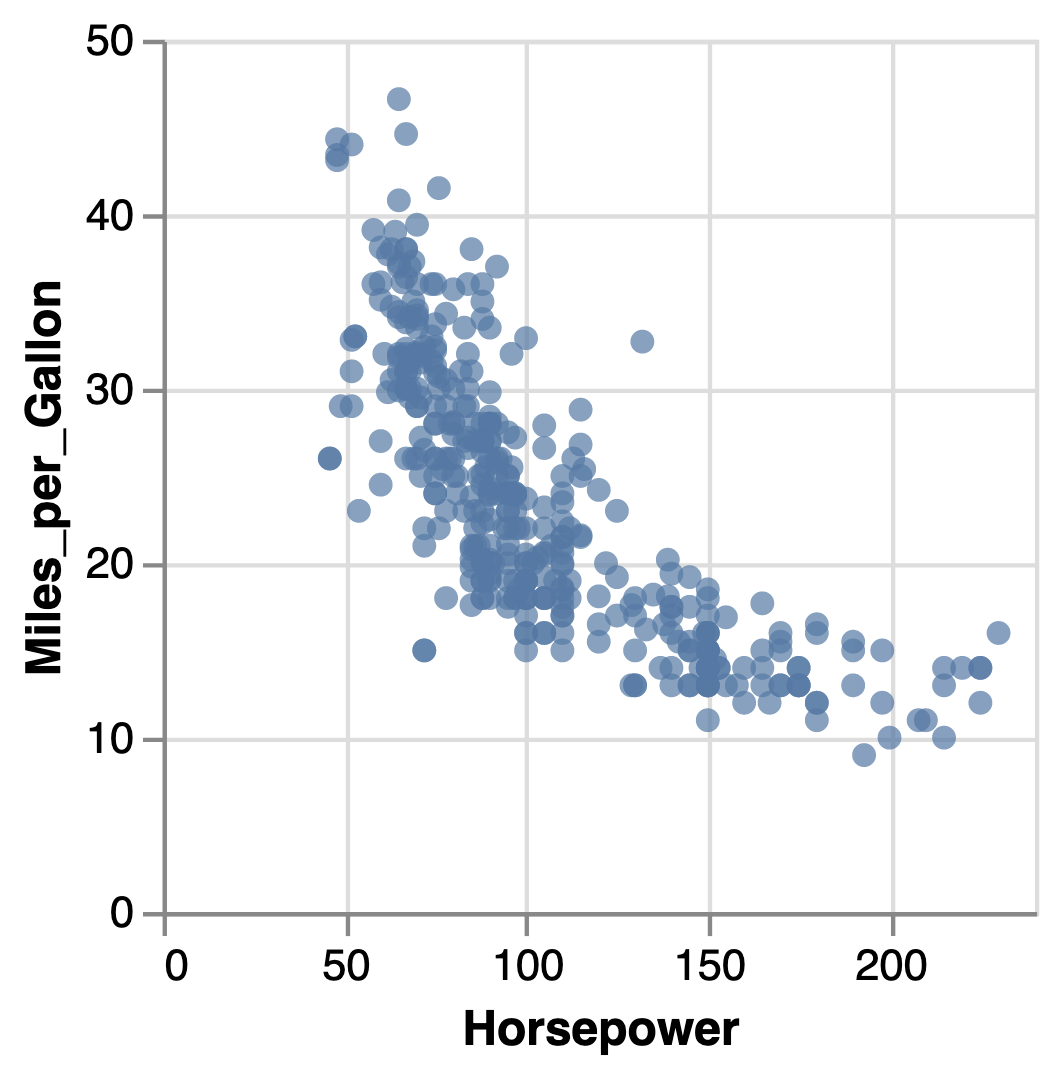 |
<br>"errorband"<br> | 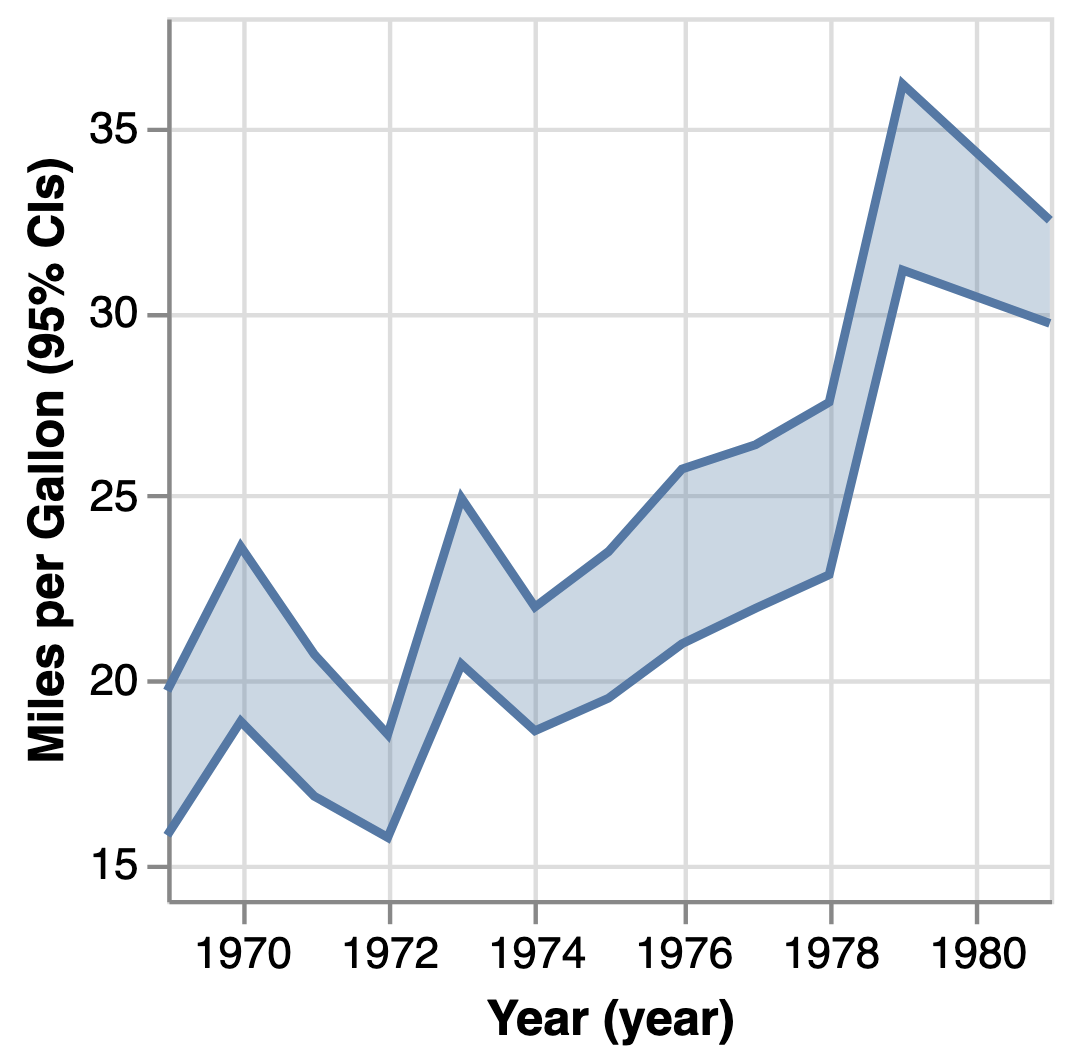 |
<br>"errorbar"<br> | 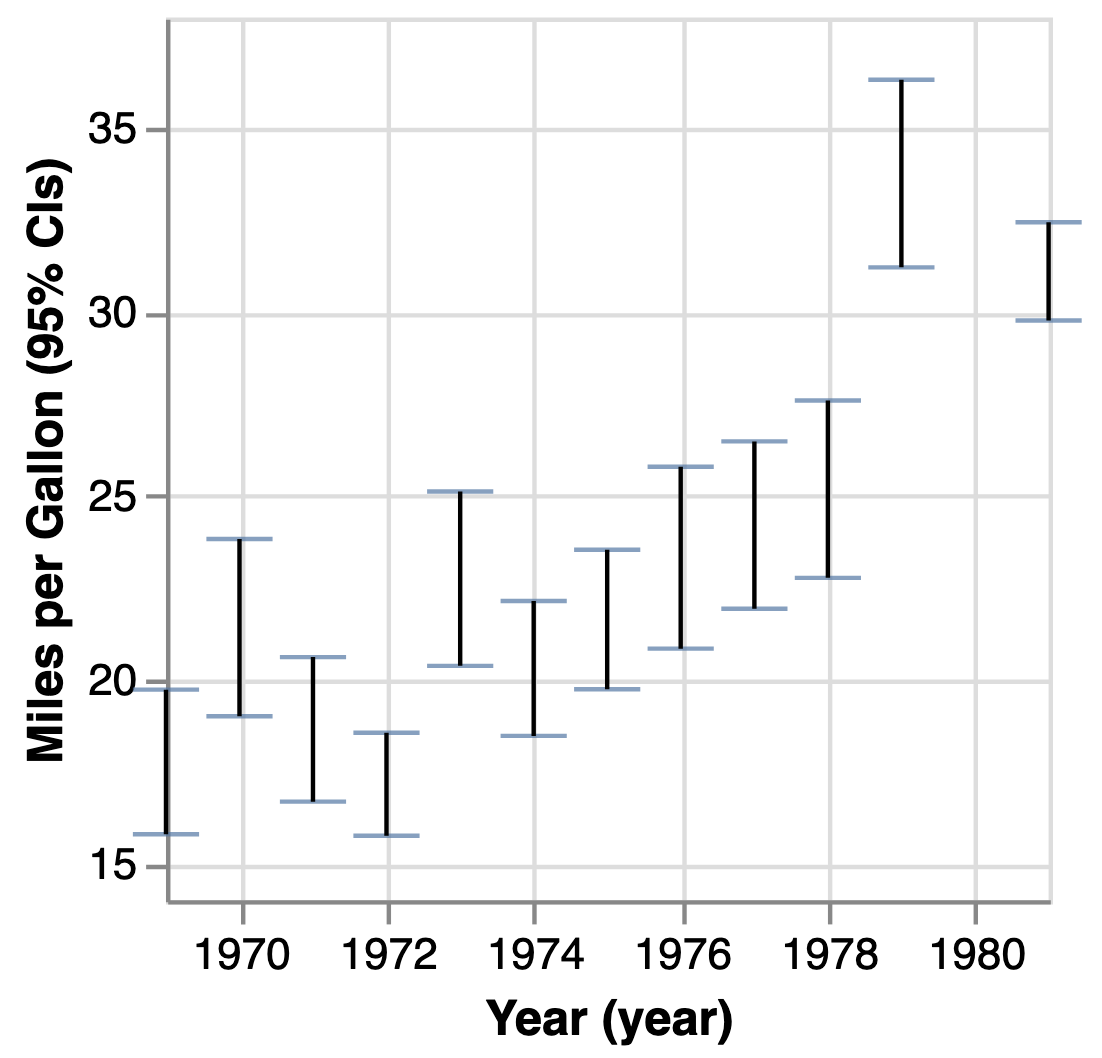 |
<br>"geoshape"<br> |  |
<br>"image"<br> | 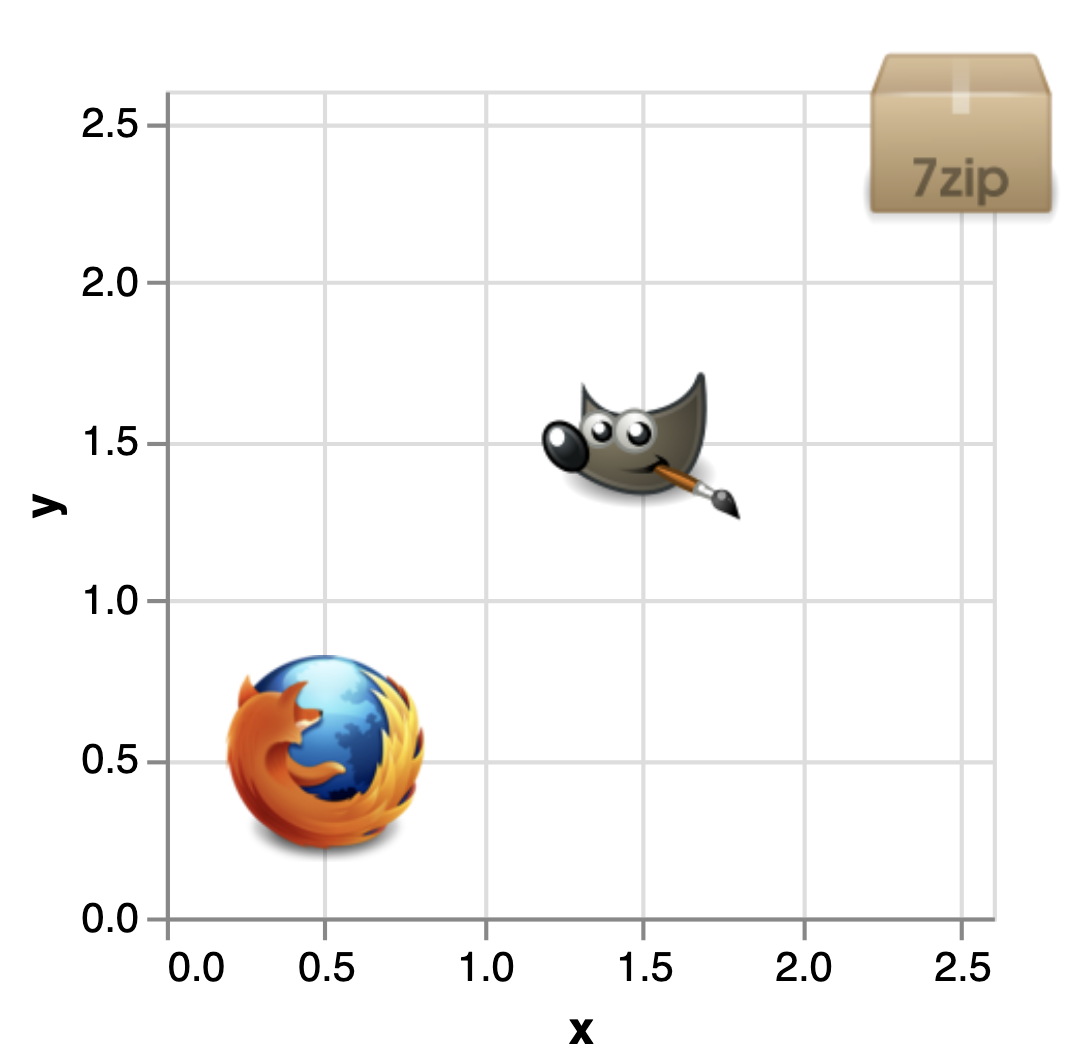 |
<br>"line"<br> | 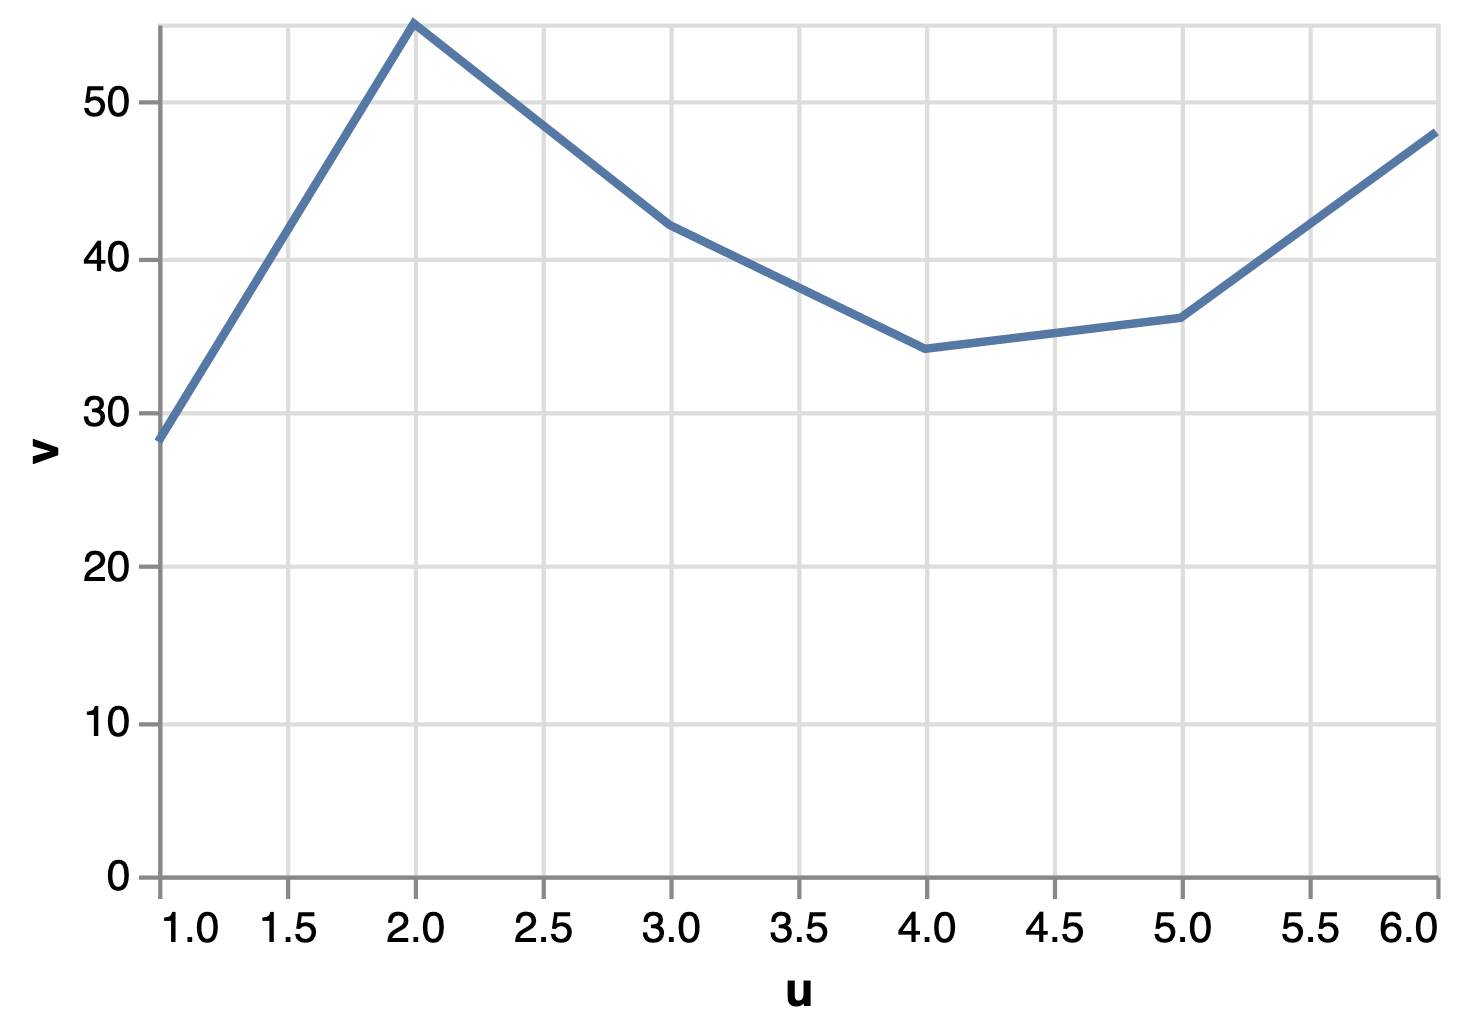 |
<br>"point"<br> | 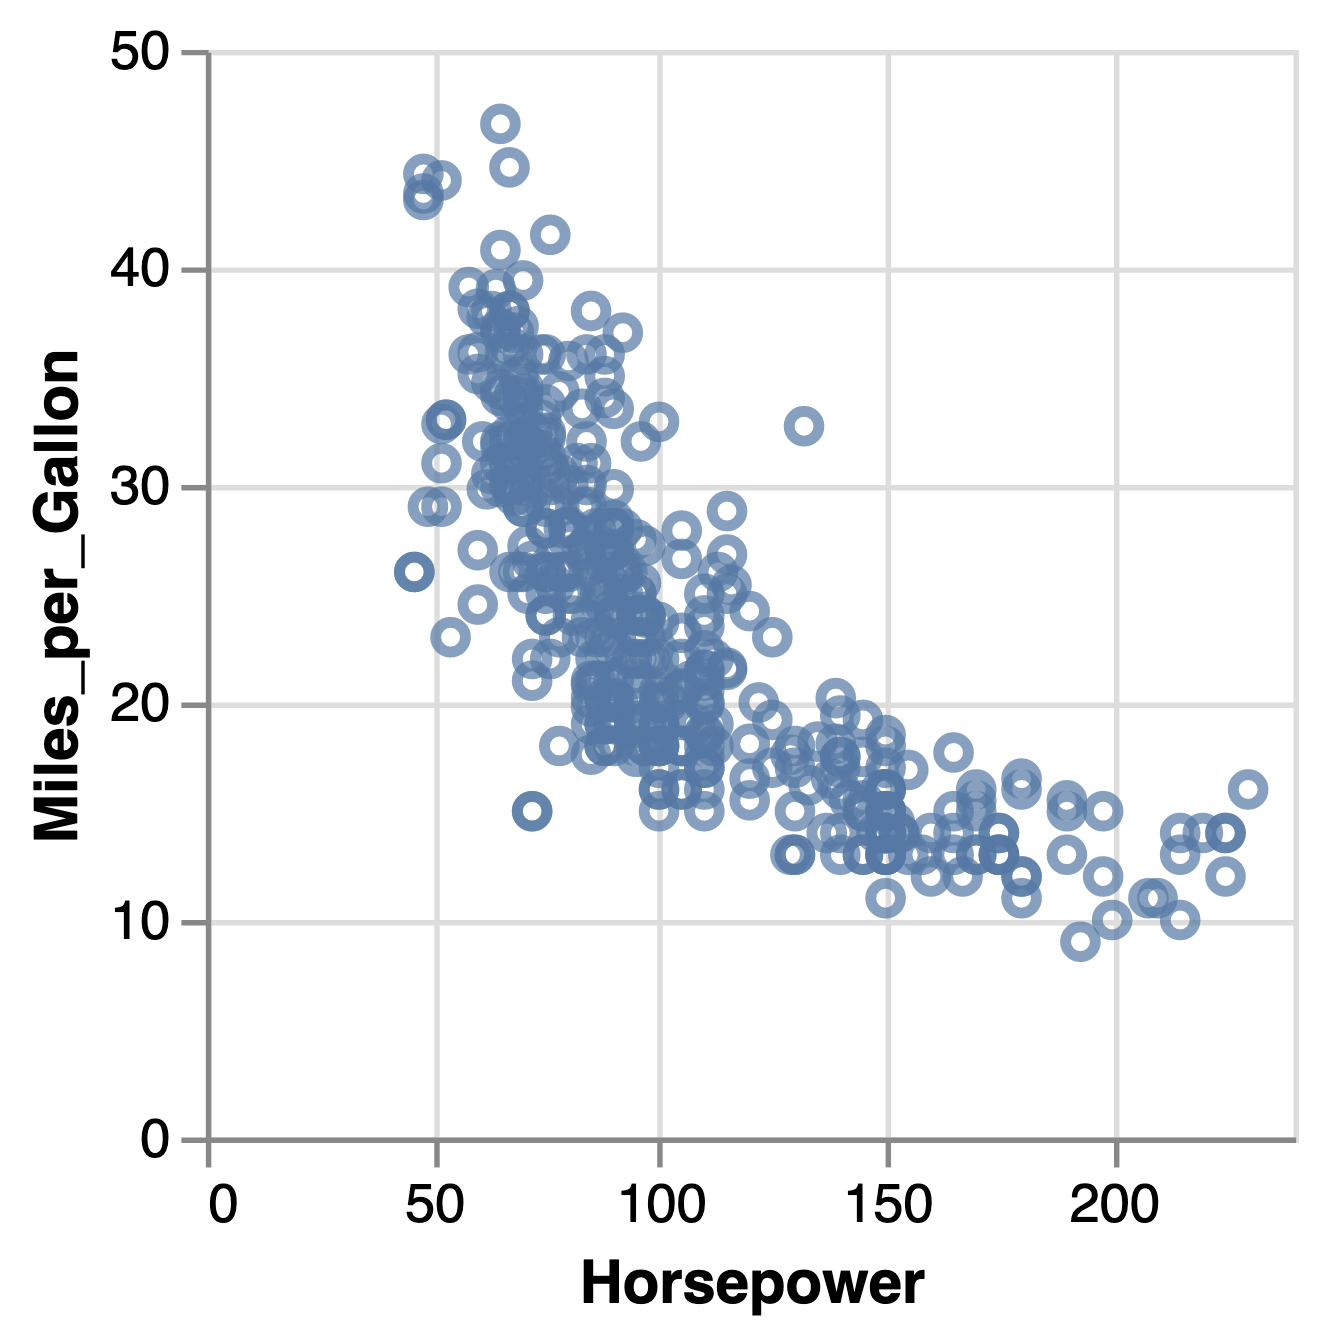 |
<br>"rect"<br> | 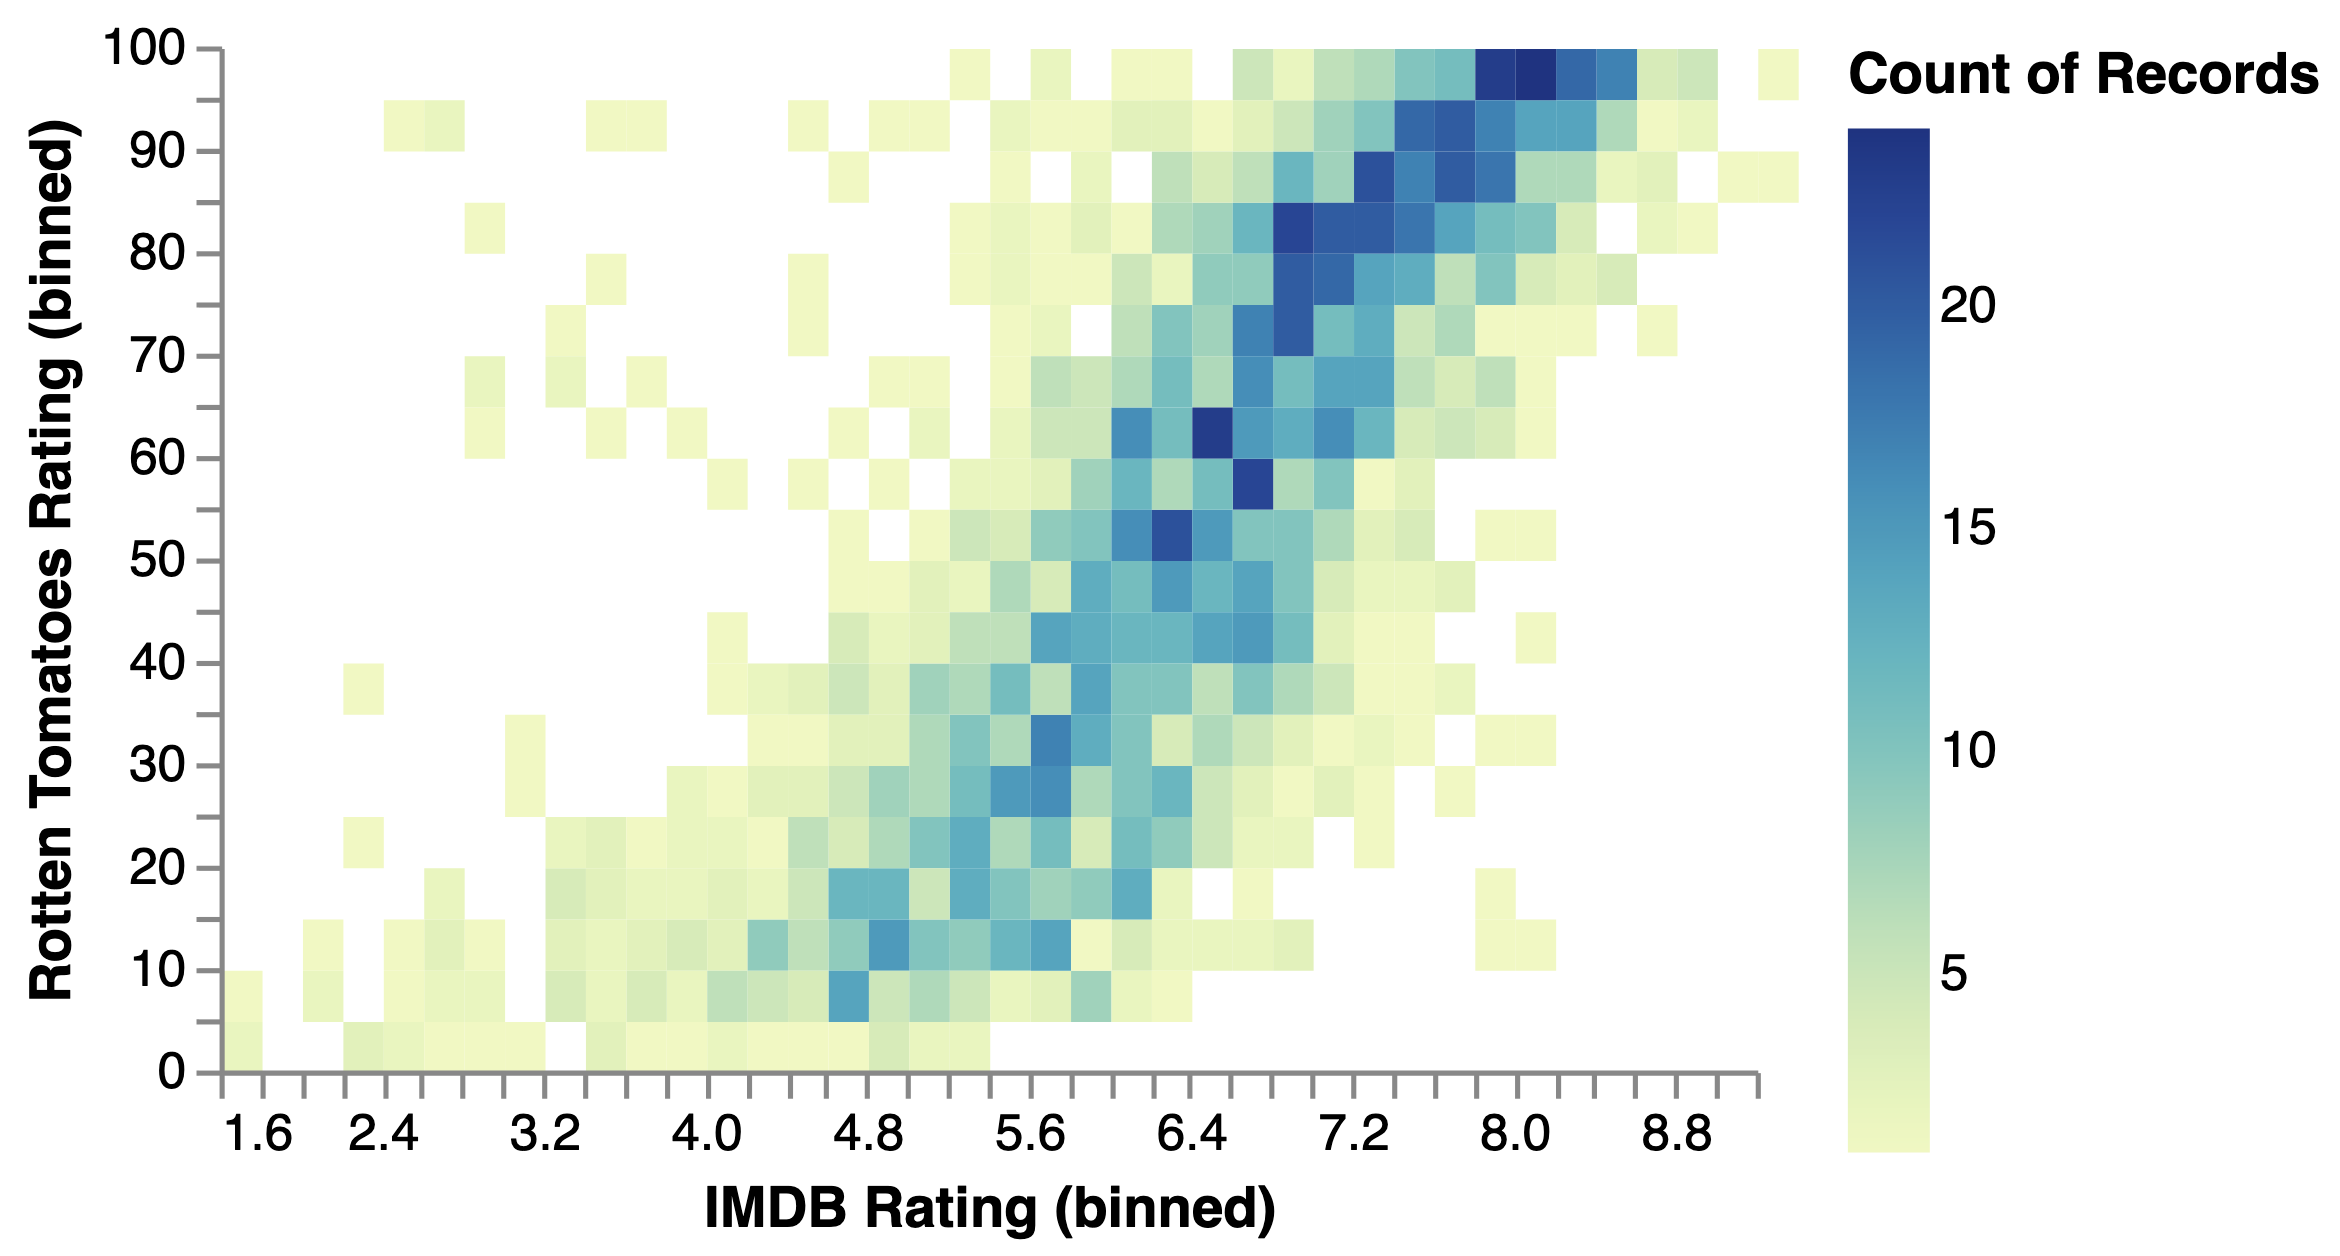 |
<br>"rule"<br> | 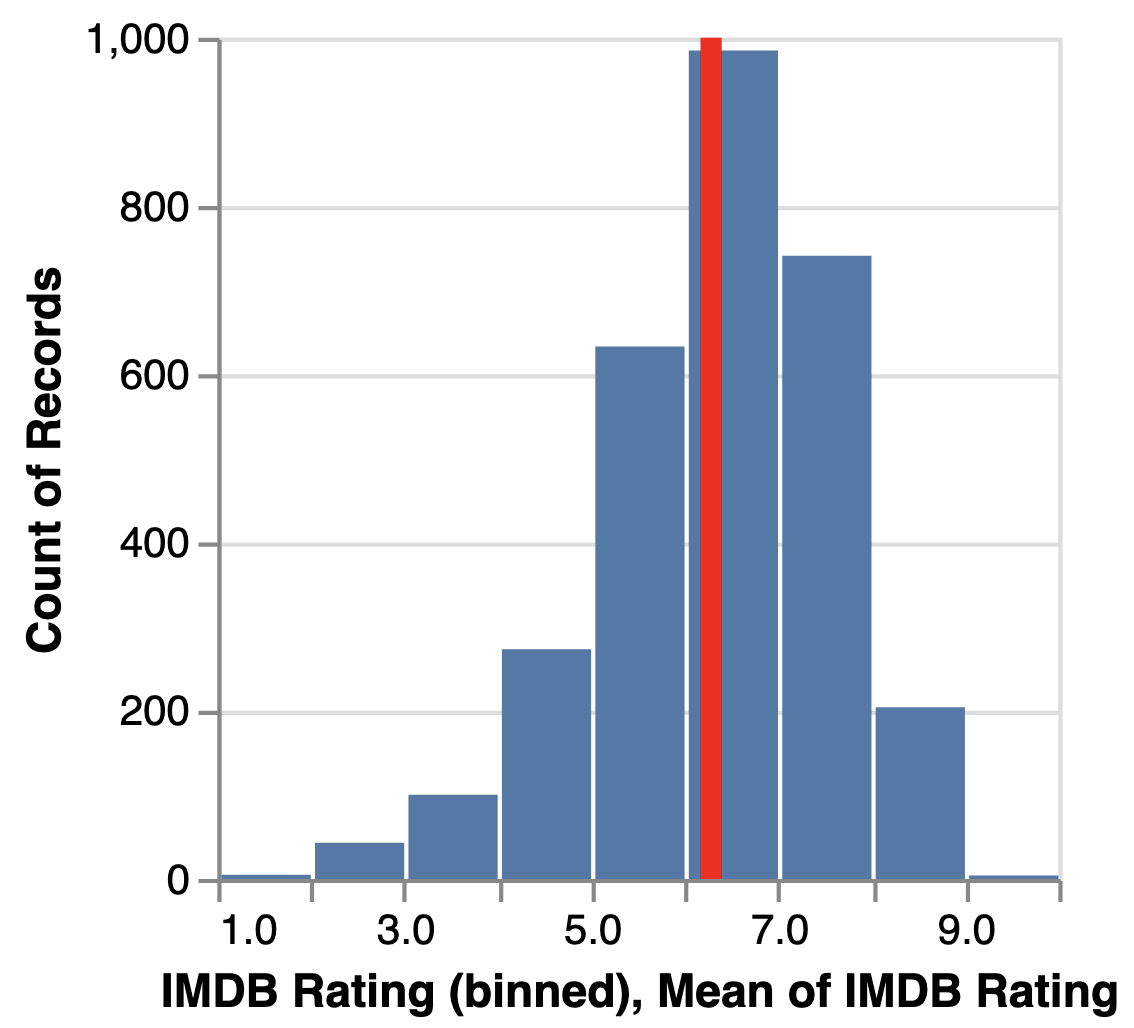 In this example, the “rule” is the red line and it is layered on top of a “bar” mark. |
<br>"square"<br> | 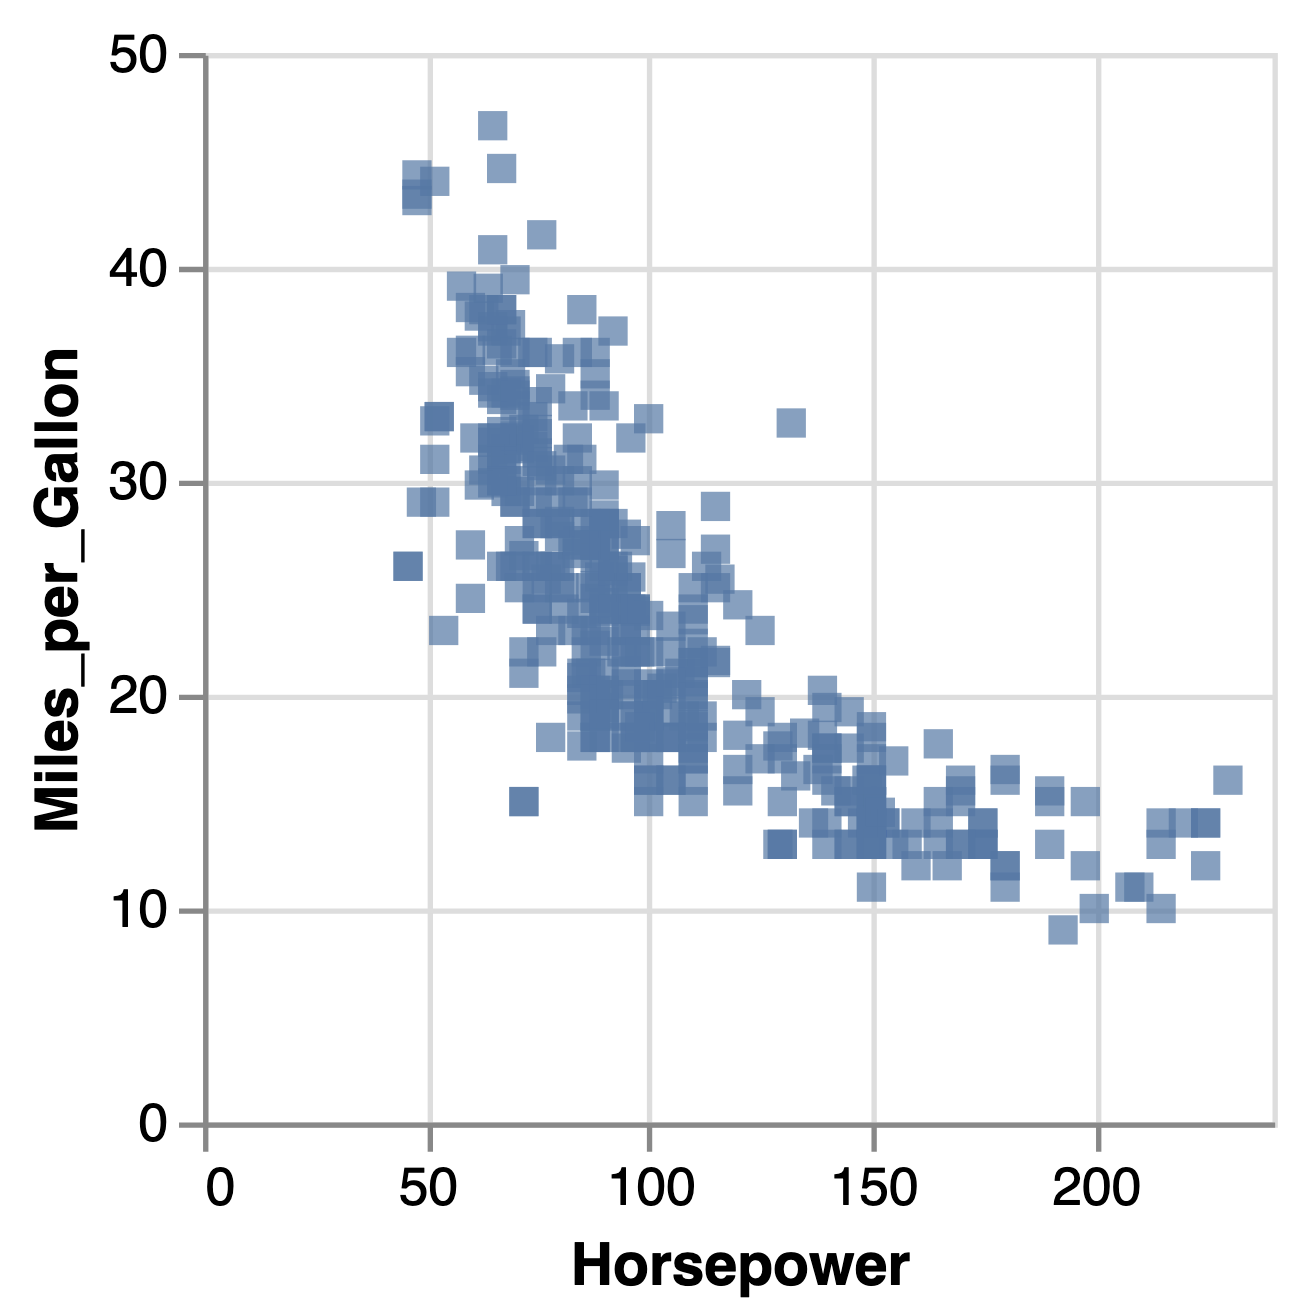 |
<br>"text"<br> | 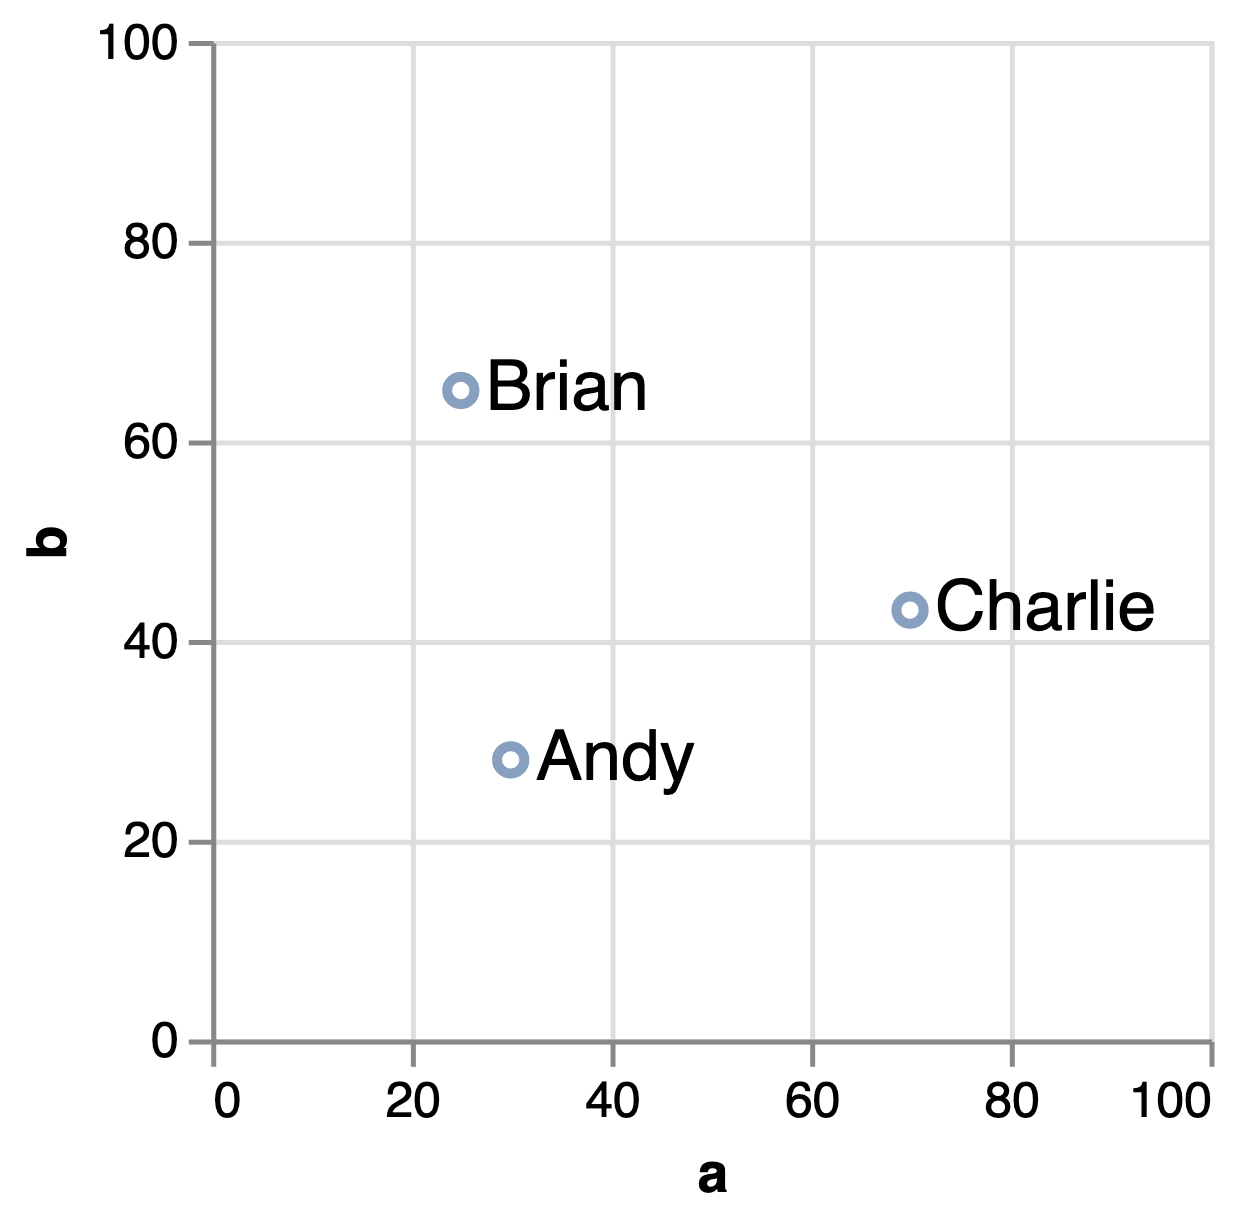 |
<br>"tick"<br> | 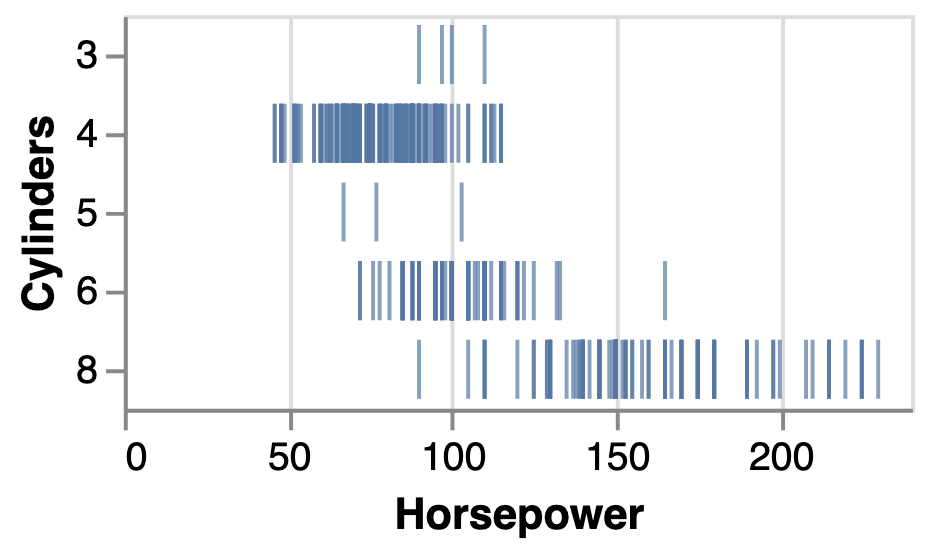 |
<br>"trail"<br> | 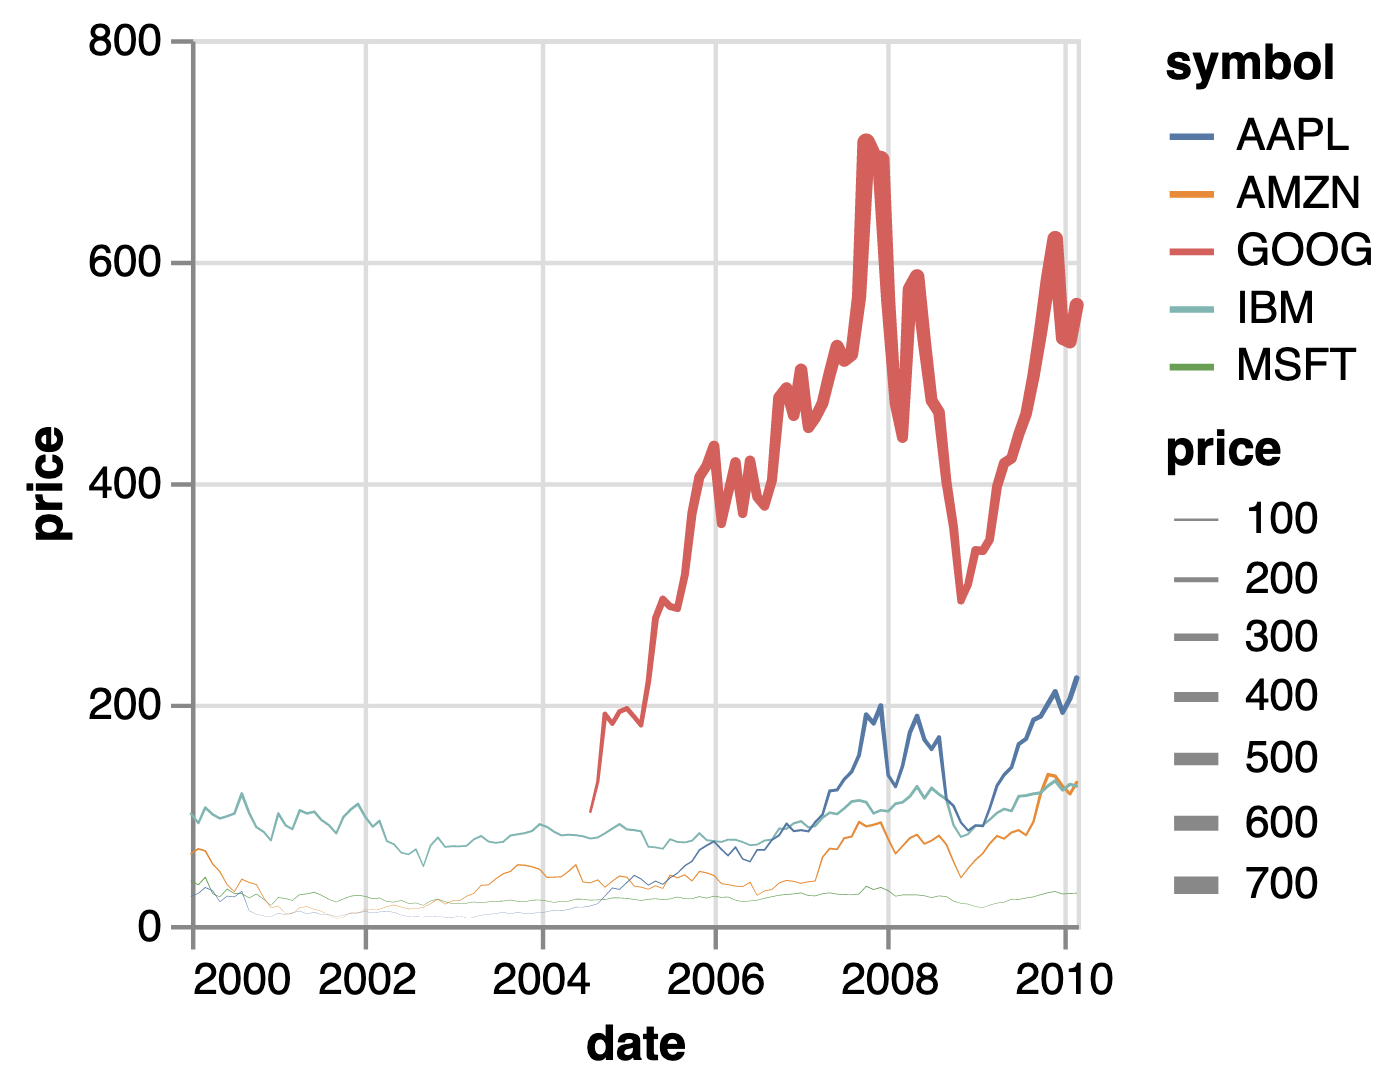 |
Type
When adding data to your x or y axis, Vega-Lite supports different data types. By default, Vega-Lite will try to infer the type for you. Here are the different types:
<br>"quantitative"<br> | Numerical data |
<br>"temporal"<br> | Date-time data |
<br>"ordinal"<br> | Ranked order data |
<br>"nominal"<br> | Categorical data |
<br>"geojson"<br> | Geo-shape files |
Tooltip
If you want to include a hover state that shows details about the data, you can add a tooltip in the “mark” section. This can be helpful when trying to debug the underlying data in your Vega-Lite.
How to add a tooltip that shows the encoded data
"mark": {
    "type": "bar",
    "tooltip": true
}
How to add a tooltip that shows ALL the underlying data
"mark": {
    "type": "bar",
    "tooltip": {
        "content": "data"
    }
}
Formatting
It is best to format your dates and numbers to be human-readable. Vega-Lite uses D3 formatting for dates and numbers.
Dates and times
This code snippet should be added to the “x” or “y” fields in the spec. In this example, it is added to the “x”.
How to format the date to m/d/yyyy (no leading zeros)
"x": {
    "type": "temporal",
    "format": "%-m/%-d/%Y"
}
Numbers
This code snippet should be added to the “x” or “y” fields in the spec. In these examples, it is added to the “y”.
How to format the number to have commas every 3 digits
"y": {
    "type": "quantitative",
    "format": ","
}
How to format the number to a percent Note: D3 will multiply the number by 100 and add the % symbol
"y": {
    "type": "quantitative",
    "format": "%"
}
How to format the number to have commas every 3 digits, round to 2 decimal places (if not a whole number), and remove leading/trailing zeros For example, this format would produce numbers that look like 14, 14.56, or 1,405.1.
"y": {
    "type": "quantitative",
    "format": ",.2~f"
}
Axis title and labels
These code snippets should be added to the “x” or “y” fields in the spec.
How to add a label to an axis
"x": {
    "title": "Your custom title goes in these quotes"
}
How to add angled axis labels
Note: this angles the x axis labels to 66º
"x": {
    "axis": {
        "labelAngle": 66
    }
}
Changing the colors
You can customize the colors that are used in your chart by adding a “colors” section within the “encoding” block.
How to add custom colors and put the legend at the bottom
Some context for this example: “result” is the field we want to customize. “Result” could be 4 options: Positive, Still Pending, Negative, or TNP/ERROR.
"encoding": {
    "x": {...},
    "y": {...},
    "color": {
         "field": "result",
         "type": "nominal",
         "legend": {
             "orient": "bottom" // puts the legend at the bottom of the graph
         },
         "scale": {
             "domain": [
                 "Positive",
                 "Still Pending",
                 "Negative",
                 "TNP/ERROR"
             ],
             "range": [
                 "#d32f2f", // assigns Positive this hex code
                 "#fff176", // assigns Still Pending this hex code
                 "#8bc34a", // assigns Negative this hex code
                 "#cccccc" // assigns TNP/ERROR this hex code
             ]
         },
         "title": "Result" // labels the legend
    }
}