Data Grid Report Views
Overview
Data Grid provides spreadsheet-like features for report results, allowing you to sort, filter, group, and pivot your data. There are three “modes” for Data Grid views:
- List view: the default view for Data Grid
- Row groups: for grouping and summarizing while retaining visibility into row-level details
- Pivot mode: for compact summaries of data
Like other types of report views, Data Grid views can be configured in advance by report authors when editing a report, or they can be created on the fly when viewing a report.
List view
In the default list view, you can filter and sort your data, show or hide columns, and “pin” one or more of those columns. These settings are controlled from the report headers or by using Data Grid’s configuration side panels. Here’s a short video (45 seconds) showing list view features in action:
Row groups
Row groups are a halfway point between list view and pivot mode: you can see all the columns in your data, but you can also get counts, sums, and other summary functions. The best thing about row groups is that you can “drill down” by expanding a row group, in order to see the details that comprise the group. Here’s a 30-second video showing how row groups work:
Pivot mode
Pivot mode provides pivot table functionality. It builds on the capabilities of list view and row groups. If you’re new to the concept of pivot tables, see this introduction from Microsoft. Here’s a video (50 seconds) demonstrating how to use Pivot mode:
Limitations of Pivot mode
-
Advanced aggregation functions. Pivot mode supports common aggregation functions, such as sum, average, max, min, count, and count distinct. If you need a function that isn’t available, let us know; it may be possible for us to to add. In the meantime, a different type of report view, called “Pivot Table”, supports additional aggregation options.
-
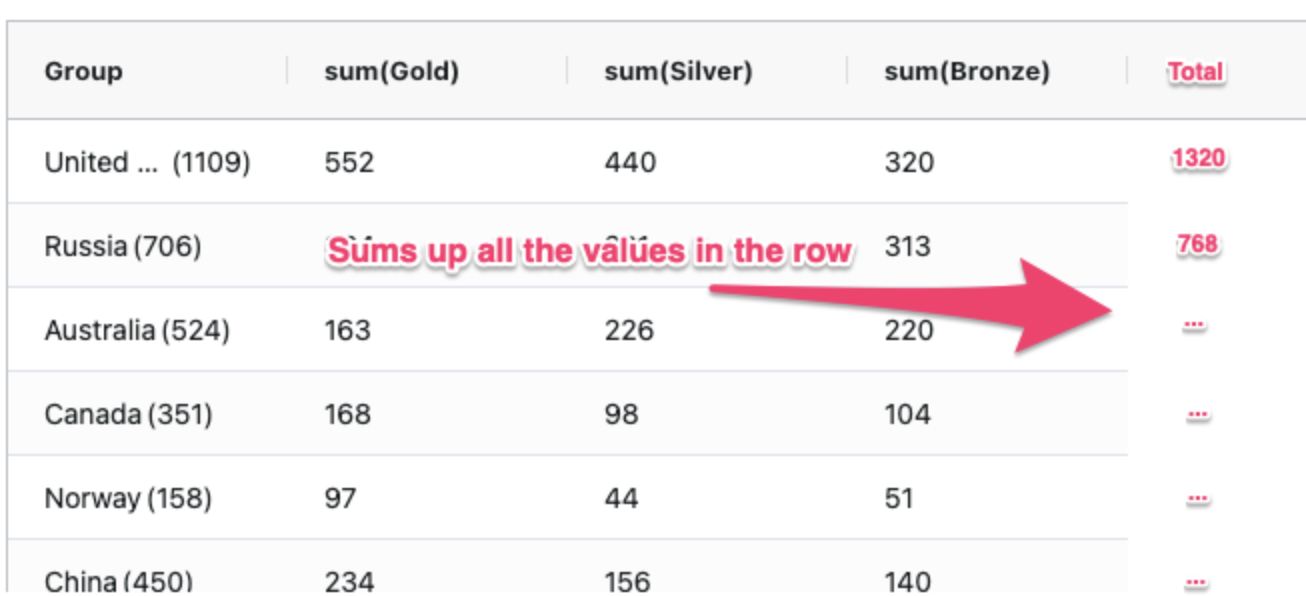
Totals column. It’s not currently possible to add a “Totals” column which would sum all the values for a given row of a pivot table, as pictured below. Adding this feature requires an enhancement from the makers of a third-party library called AG Grid. We’ve submitted this enhancement request and it’s tracked as AG-6333 in the AG Grid feature pipeline.)
-
Renaming pivot table headers. Header columns on pivot tables will display with names like “count distinct(Provider)”. It is not currently possible to rename these headers.
-
Multiple aggregations on the same data field. It is not possible to choose multiple aggregations on the same piece of data (for example, to see both the sum and the average of a column called “claim balance”). However, a workaround exists for report authors; see “ Adding multiple aggregations on the same field in Data Grid report views.”
-
Rounding precision. When using aggregation functions like AVERAGE, we have limited the results to a maximum of two decimal points. This precision cannot be adjusted by report authors or viewers. (This choice is designed to cover the problem that floating-point math can otherwise cause aggregate functions to produce results like “15.000001%”.)
Links
Data Grid supports links to other pages in Relevant or external sites. To add a link, create a column prefixed with __link_for_:
select last_name || ', ' || first_name as name,
       '/patients/' || id as __link_for_name
from rdm.patients;
Links work only within the Relevant app. Exported reports will contain the raw __link_for_ column.
Frequently asked questions
Q: Can I export a Data Grid view to Excel?
A: Yes, and the export will respect the majority of the configuration and filters that are applied in the view. (For example, a Data Grid view showing a pivot table will export the contents of the pivot table, not the underlying raw data.) To export, right-click on any Data Grid view, and you’ll get a menu that allows export to both Excel and CSV. Here’s what it looks like:
Note: When exporting pivot tables powered by Data Grid, the totals row will not be included. If the report includes PHI, only users with the “Export PHI” ability will see these export options.
Q: Can I adjust the format of numbers? For example, to add currency markers or change date styles?
A: No, this is not possible using the Data Grid interface. However, report authors can specify the format of columns using SQL in the report definition.
Resources
- View a recording of our training on Report Builder, which includes a demonstration Data Grid features.
- Behind the scenes, the functionality of Data Grid views is provided by a third-party library called AG Grid. Not all features supported by AG Grid can be implemented within Relevant, but you might still find the AG Grid website informative.