Creating a Report
Building a report requires the “Manage Reports” ability and some familiarity with SQL. If you’re not comfortable with SQL, try using Data Explorer for a guided way to explore and export data.
Ways to create a report
Start from scratch
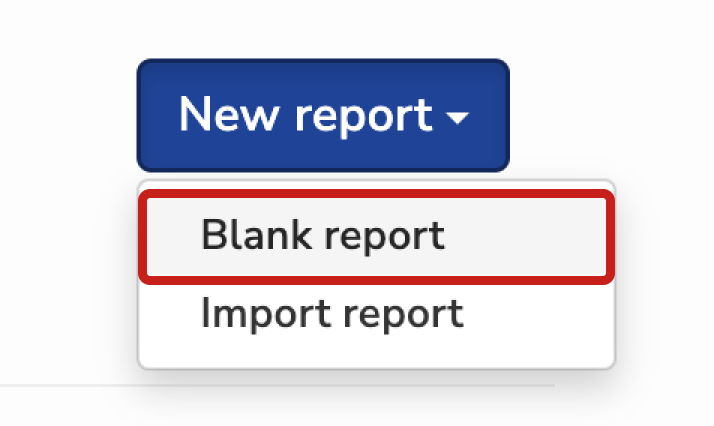
Navigate to Reports in the main menu, click New report and select Blank report. Use this when you want full control over the report structure and SQL.
Duplicate an existing report
Open the report you want to copy and click Duplicate. Duplicating preserves SQL, parameters, and views. Use this when you want to build a new report similar to an existing one without starting from scratch.

Copy a report across health centers
Only for users with access to multiple health centers.
- Open the report you want to copy and click Copy.
- Log in to the other health center, navigate to Reports, and click New report.
- Select Import report, paste the copied definition, and click Import.
Use this when you want the same report in a different health center.

Report details
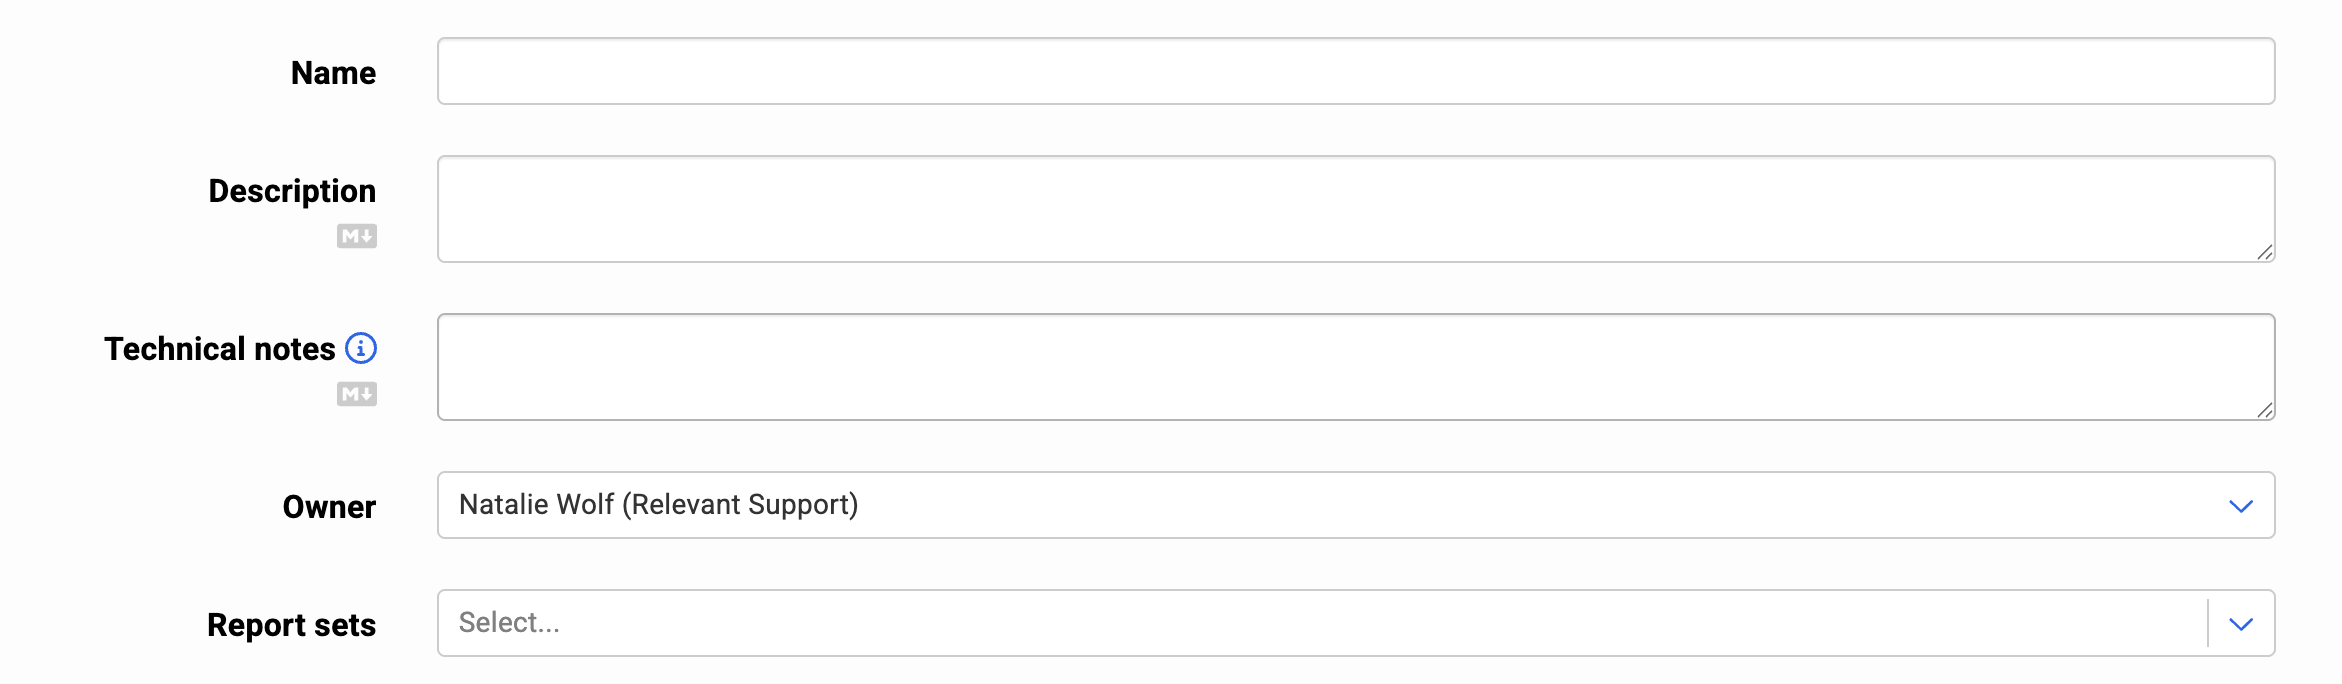
Provide the basic information that identifies, organizes, and documents your report.
Name and description
Enter a descriptive name and description. Descriptions can be formatted with MarkDown, which allows for headings, bold text, links, images, and more.
Technical notes
Document key details about how this report is built, such as structure, logic, or data sources. This information will not be visible on Dashboards. Technical notes can also be formatted with MarkDown.
Owner
Choose the user who will be responsible for mainting the report
Report sets
Add the report to one or more report sets to control organization and make it easier for others to find.
Report access
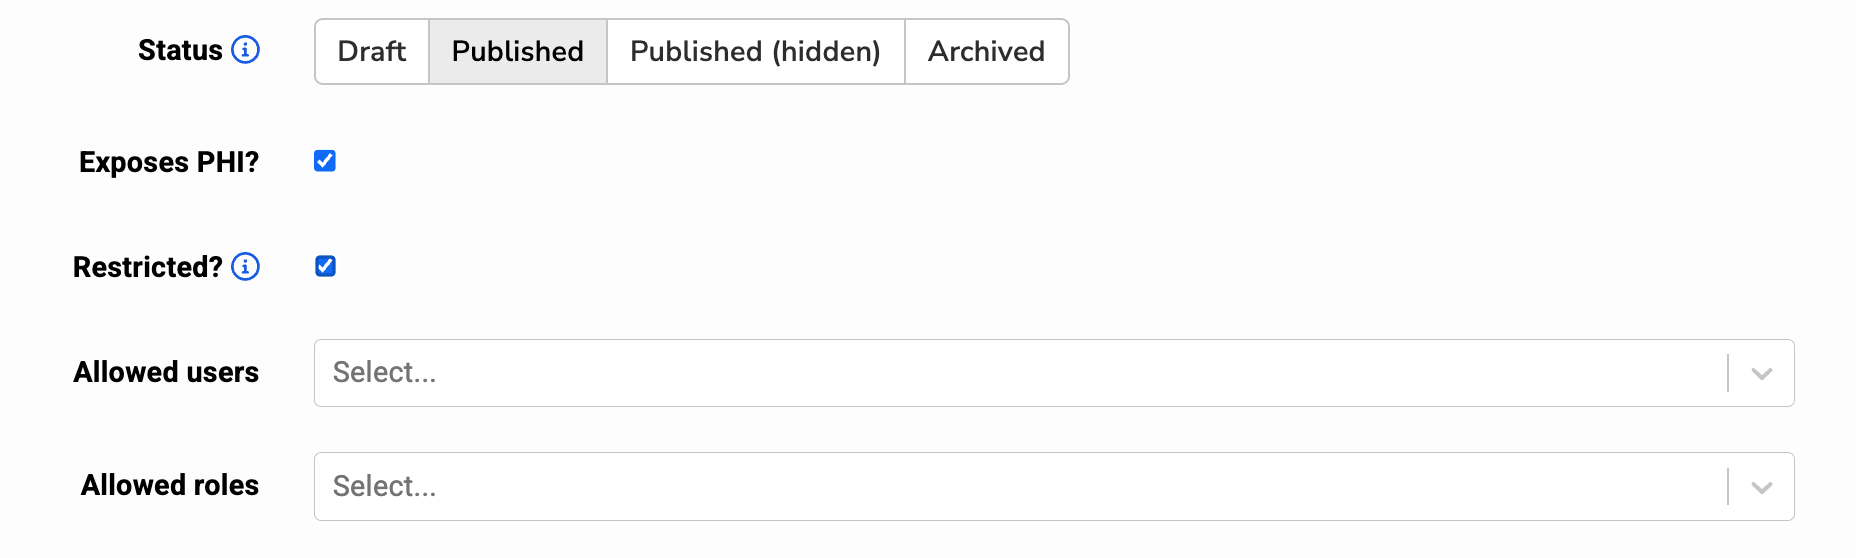
Report status
The status determines visibility for report viewers (i.e. users with the “View Reports” ability) in the Reports list and Dashboards.
- Draft: The “Draft” status is for reports that are still being created or edited. Report viewers cannot see draft reports in the Reports list, but they can access them if provided with a direct link.
- Published: The “Published” status is for reports that are finalized, validated, and actively used by your organization. These reports are visible to report viewers in the Reports list.
- Published (hidden): The “Published (hidden)” status applies to reports that are finalized and published but not displayed in the Reports list for report viewers. Use this status to keep the Reports list uncluttered, especially for reports created specifically for Dashboards.
- Archived: The “Archived” status is for reports that have been retired or are no longer relevant. Archived reports are not visible to report viewers in the Reports list.
Additional access controls
-
Exposes PHI: Indicates if the report results will include any Protected Health Information. This will further restrict access to the report based on how PHI restrictions are configured for your health center.
-
Restricted: Limits access to the report to a list of specific users or roles. Note: users with the “Manage Reports” ability will always retain access.
Report primary use
Keep your reports organized by specifying how you intend this report to be used. While this doesn’t impact any functionality in Relevant, it helps categorize your reports for future reference.
- Standalone report: The report will be run from the Reports module.
- Dashboard only: The report will be used as a Dashboard tile only.
- Both: The report will be used in both the Report module and as a Dashboard tile.

Report parameters and SQL queries
Parameters
Parameters customize a report at run time (for example, by date range, provider, or location). Use parameters when the same report needs to support different inputs without editing SQL. Read more about parameters.
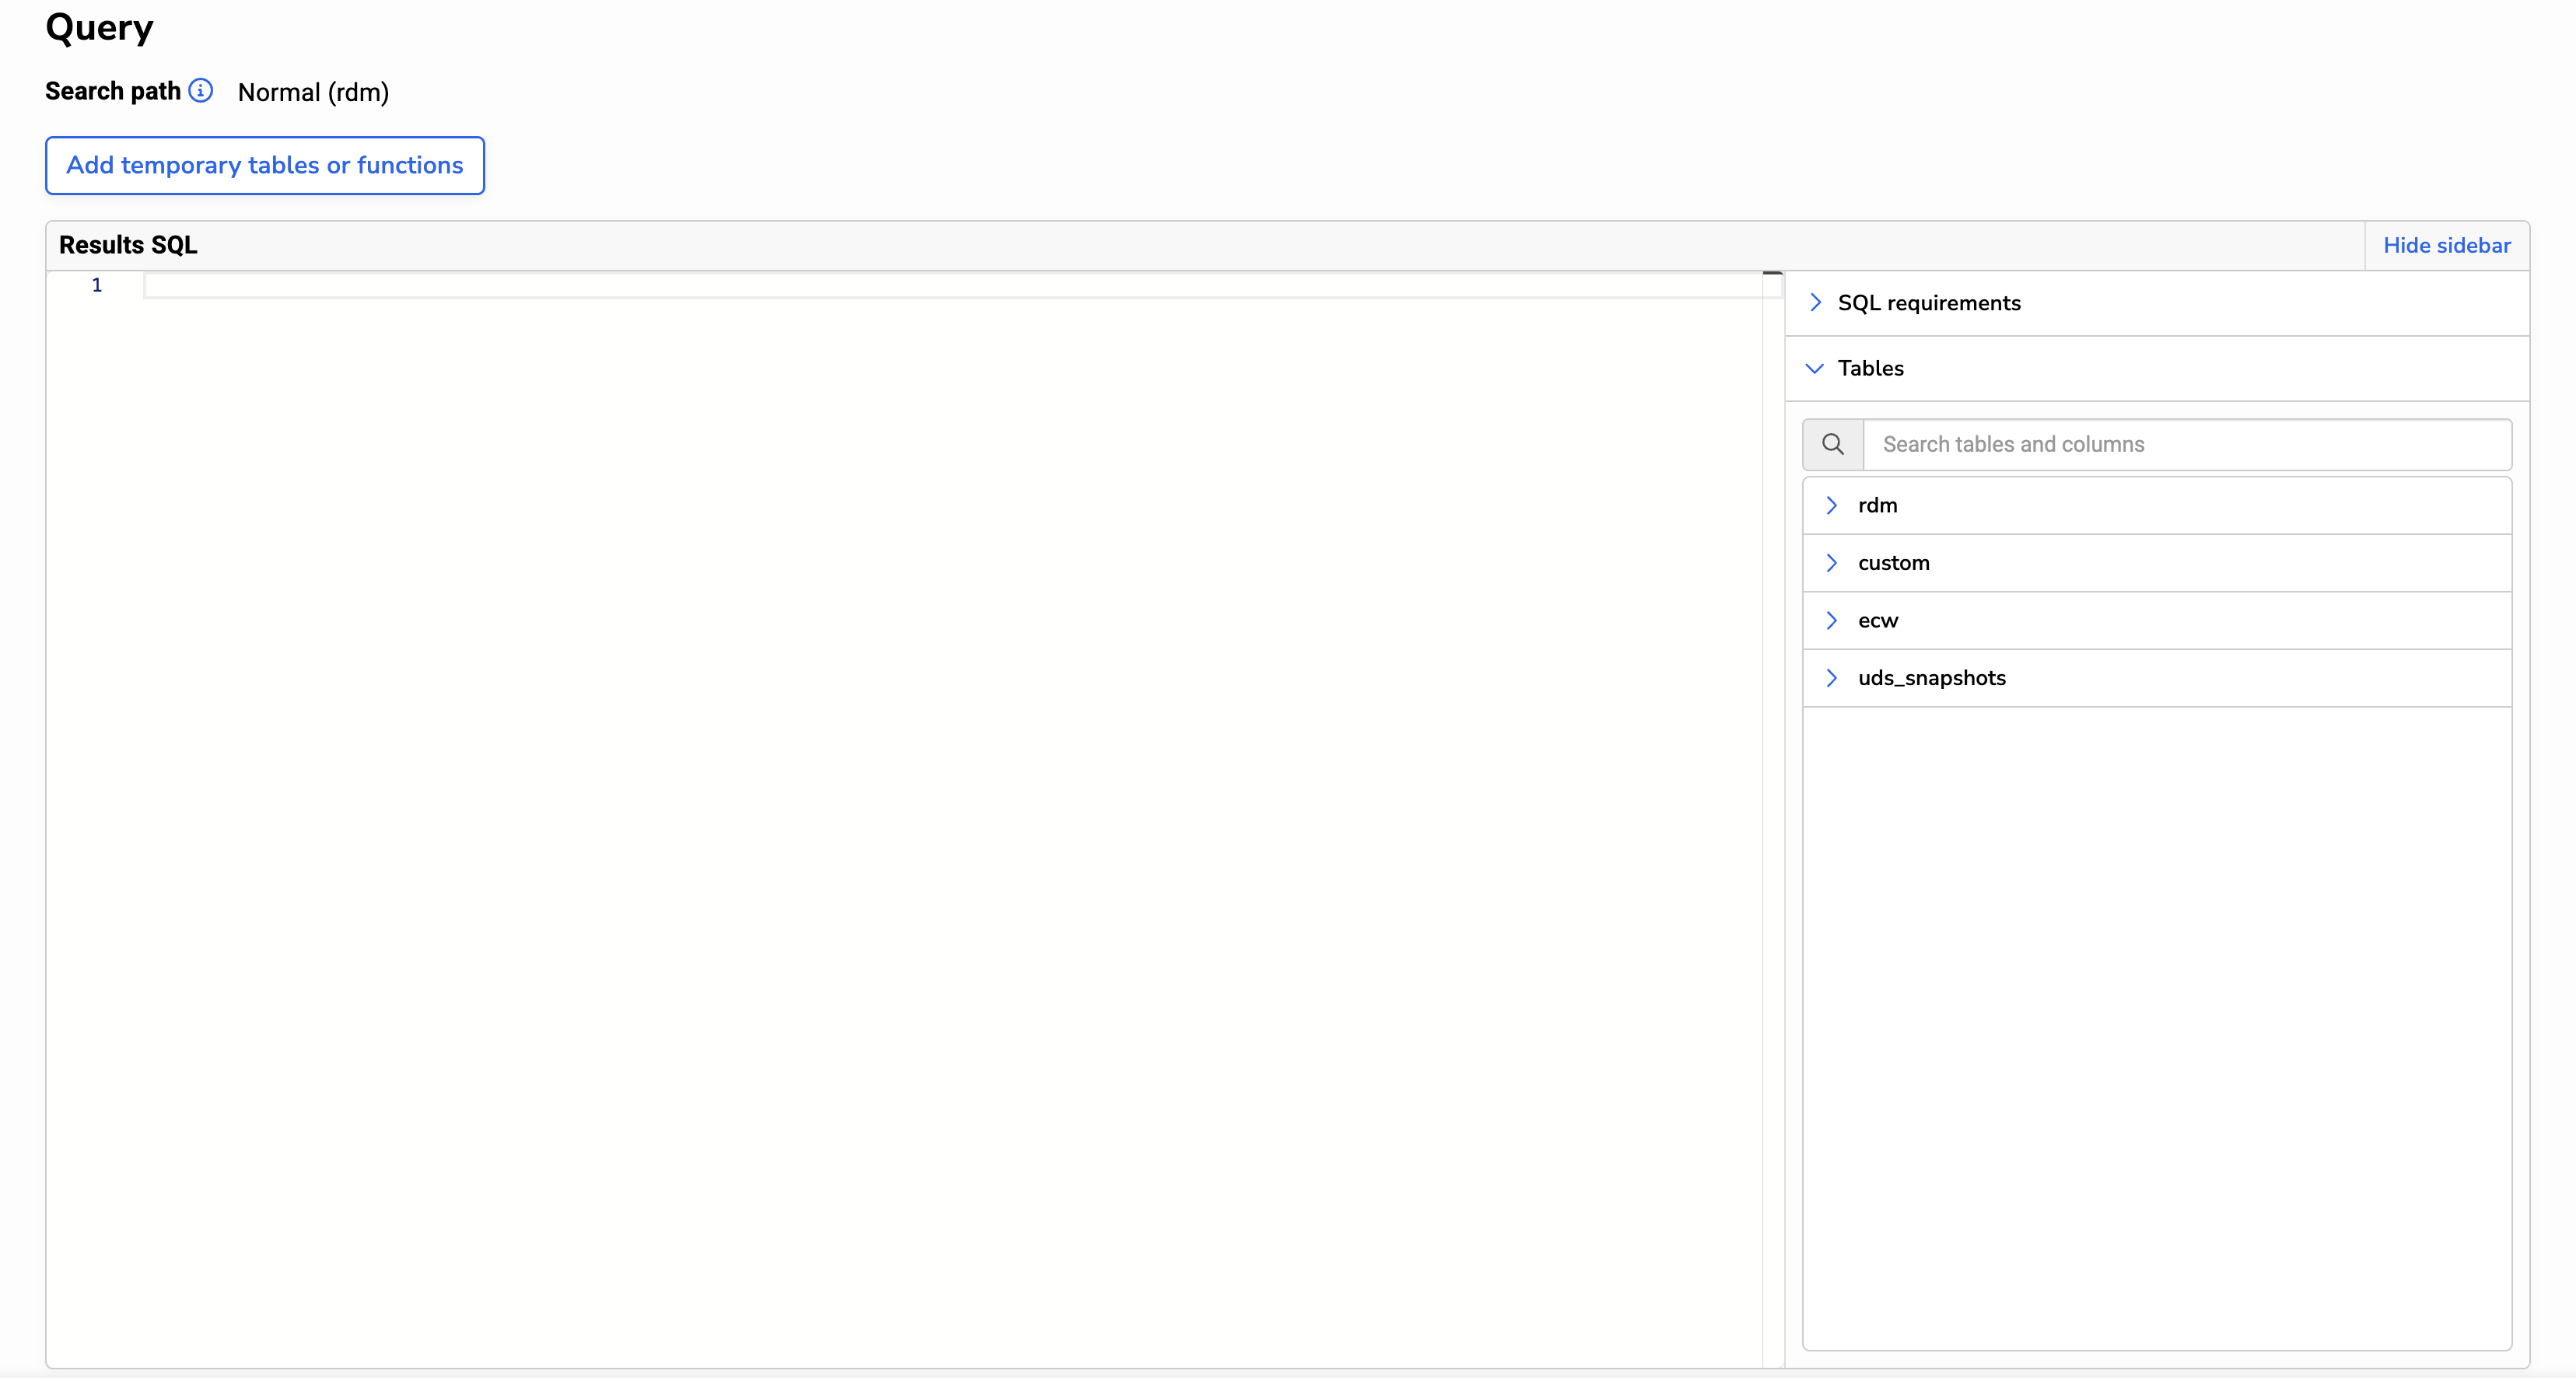
SQL queries
Queries run in two steps:
- Temporary tables and functions SQL (optional): Use this editor to create temporary tables or helper functions. This SQL runs before the Results SQL.
- Results SQL: The main query that defines the report output. This must be a single
SELECTstatement.
Results and report views
Report results are displayed after you run the report. By default, results appear in a Data Grid view. Pro-tip: instead of clicking Run, you can use the keyboard shortcut CTRL + ENTER to run your report.
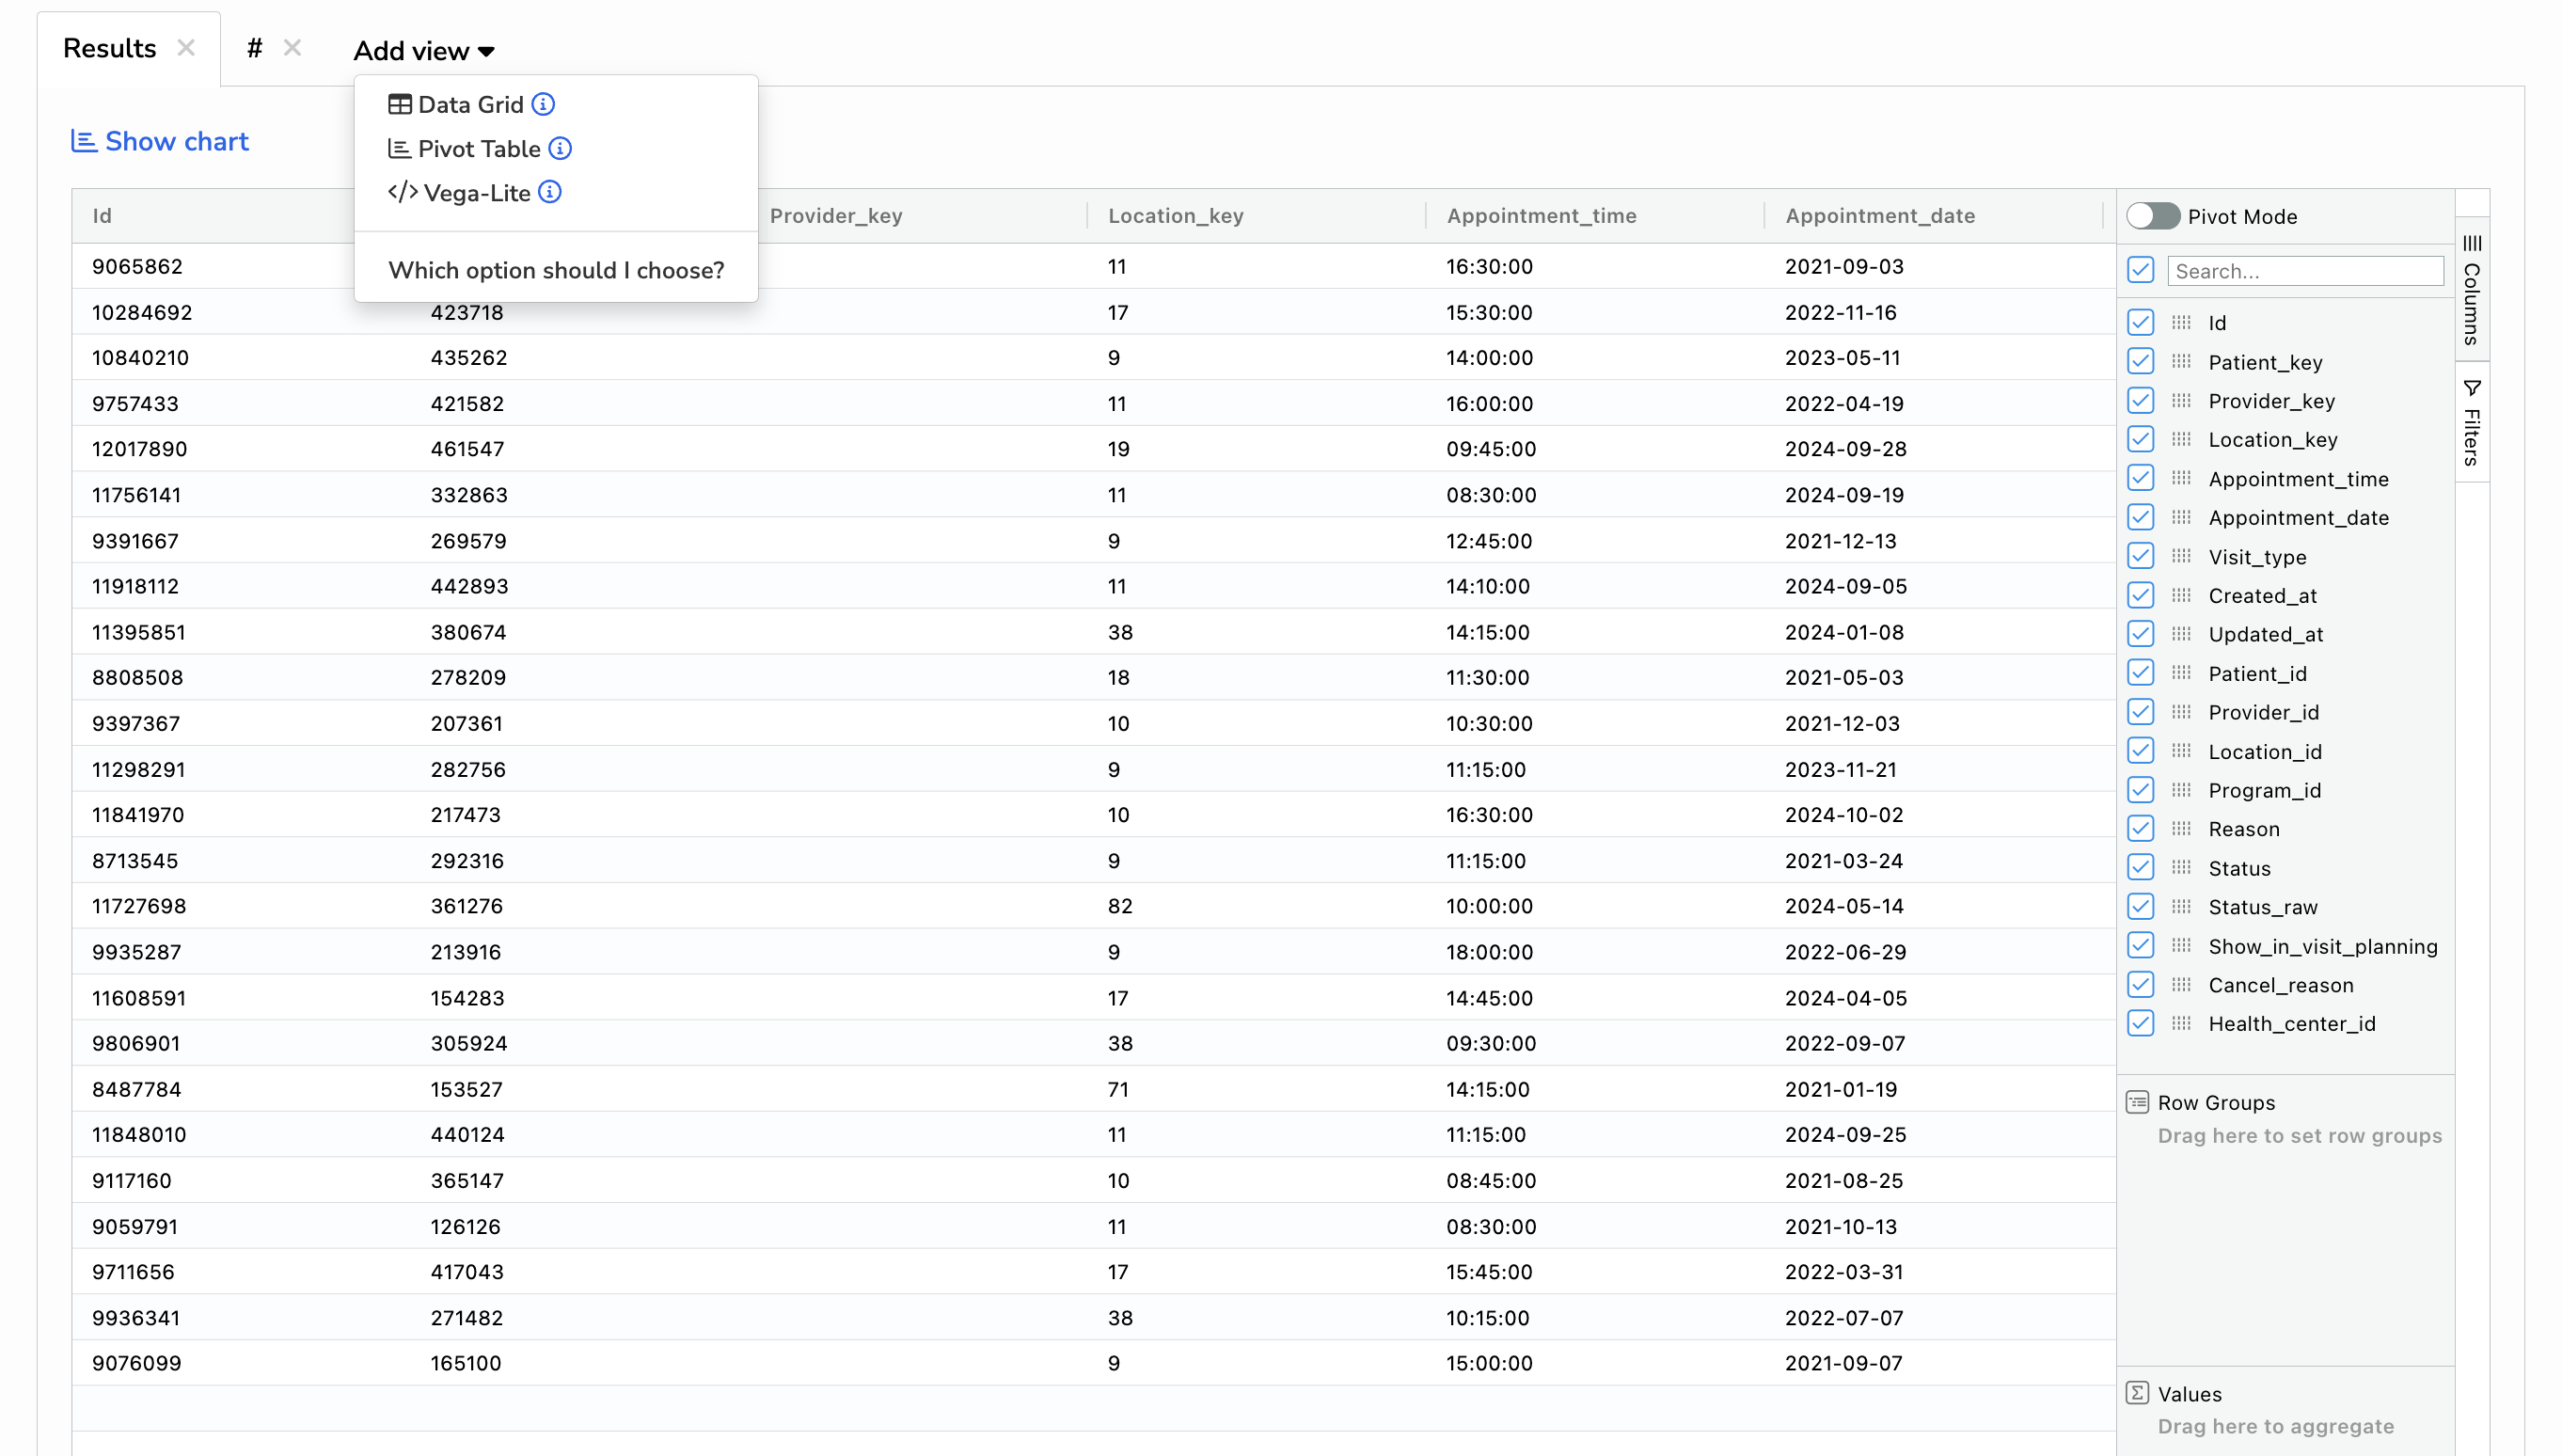
Additional report views
After running your report, you can add alternative views to explore or visualize the data. Click Add view and choose a view type. If the report returns no rows, additional views cannot be added.
You can add the following types of views:
- Data Grid: a spreadsheet-like view that includes filtering, grouping, and pivot tables.
- Pivot Table: a quick way to create charts or an alternative if the Data Grid pivot tables don’t meet your needs.
- Vega-Lite: build custom data visualizations using the Vega-Lite grammar.