Executive Dashboard
This dashboard puts key operational and quality indicators in front of your health center’s leadership team. It’s a library dashboard, meaning you can use it as-is, or customize it to meet your health center’s needs.
Add the Executive Dashboard
Navigate to Reports > Dashboards, then choose New Dashboard > Executive Dashboard
The following screenshot shows the dashboard when all required data elements are mapped. For a larger view, open this image, then zoom in. Below the screenshot, read more about why these metrics are important and some tips about how to improve them.
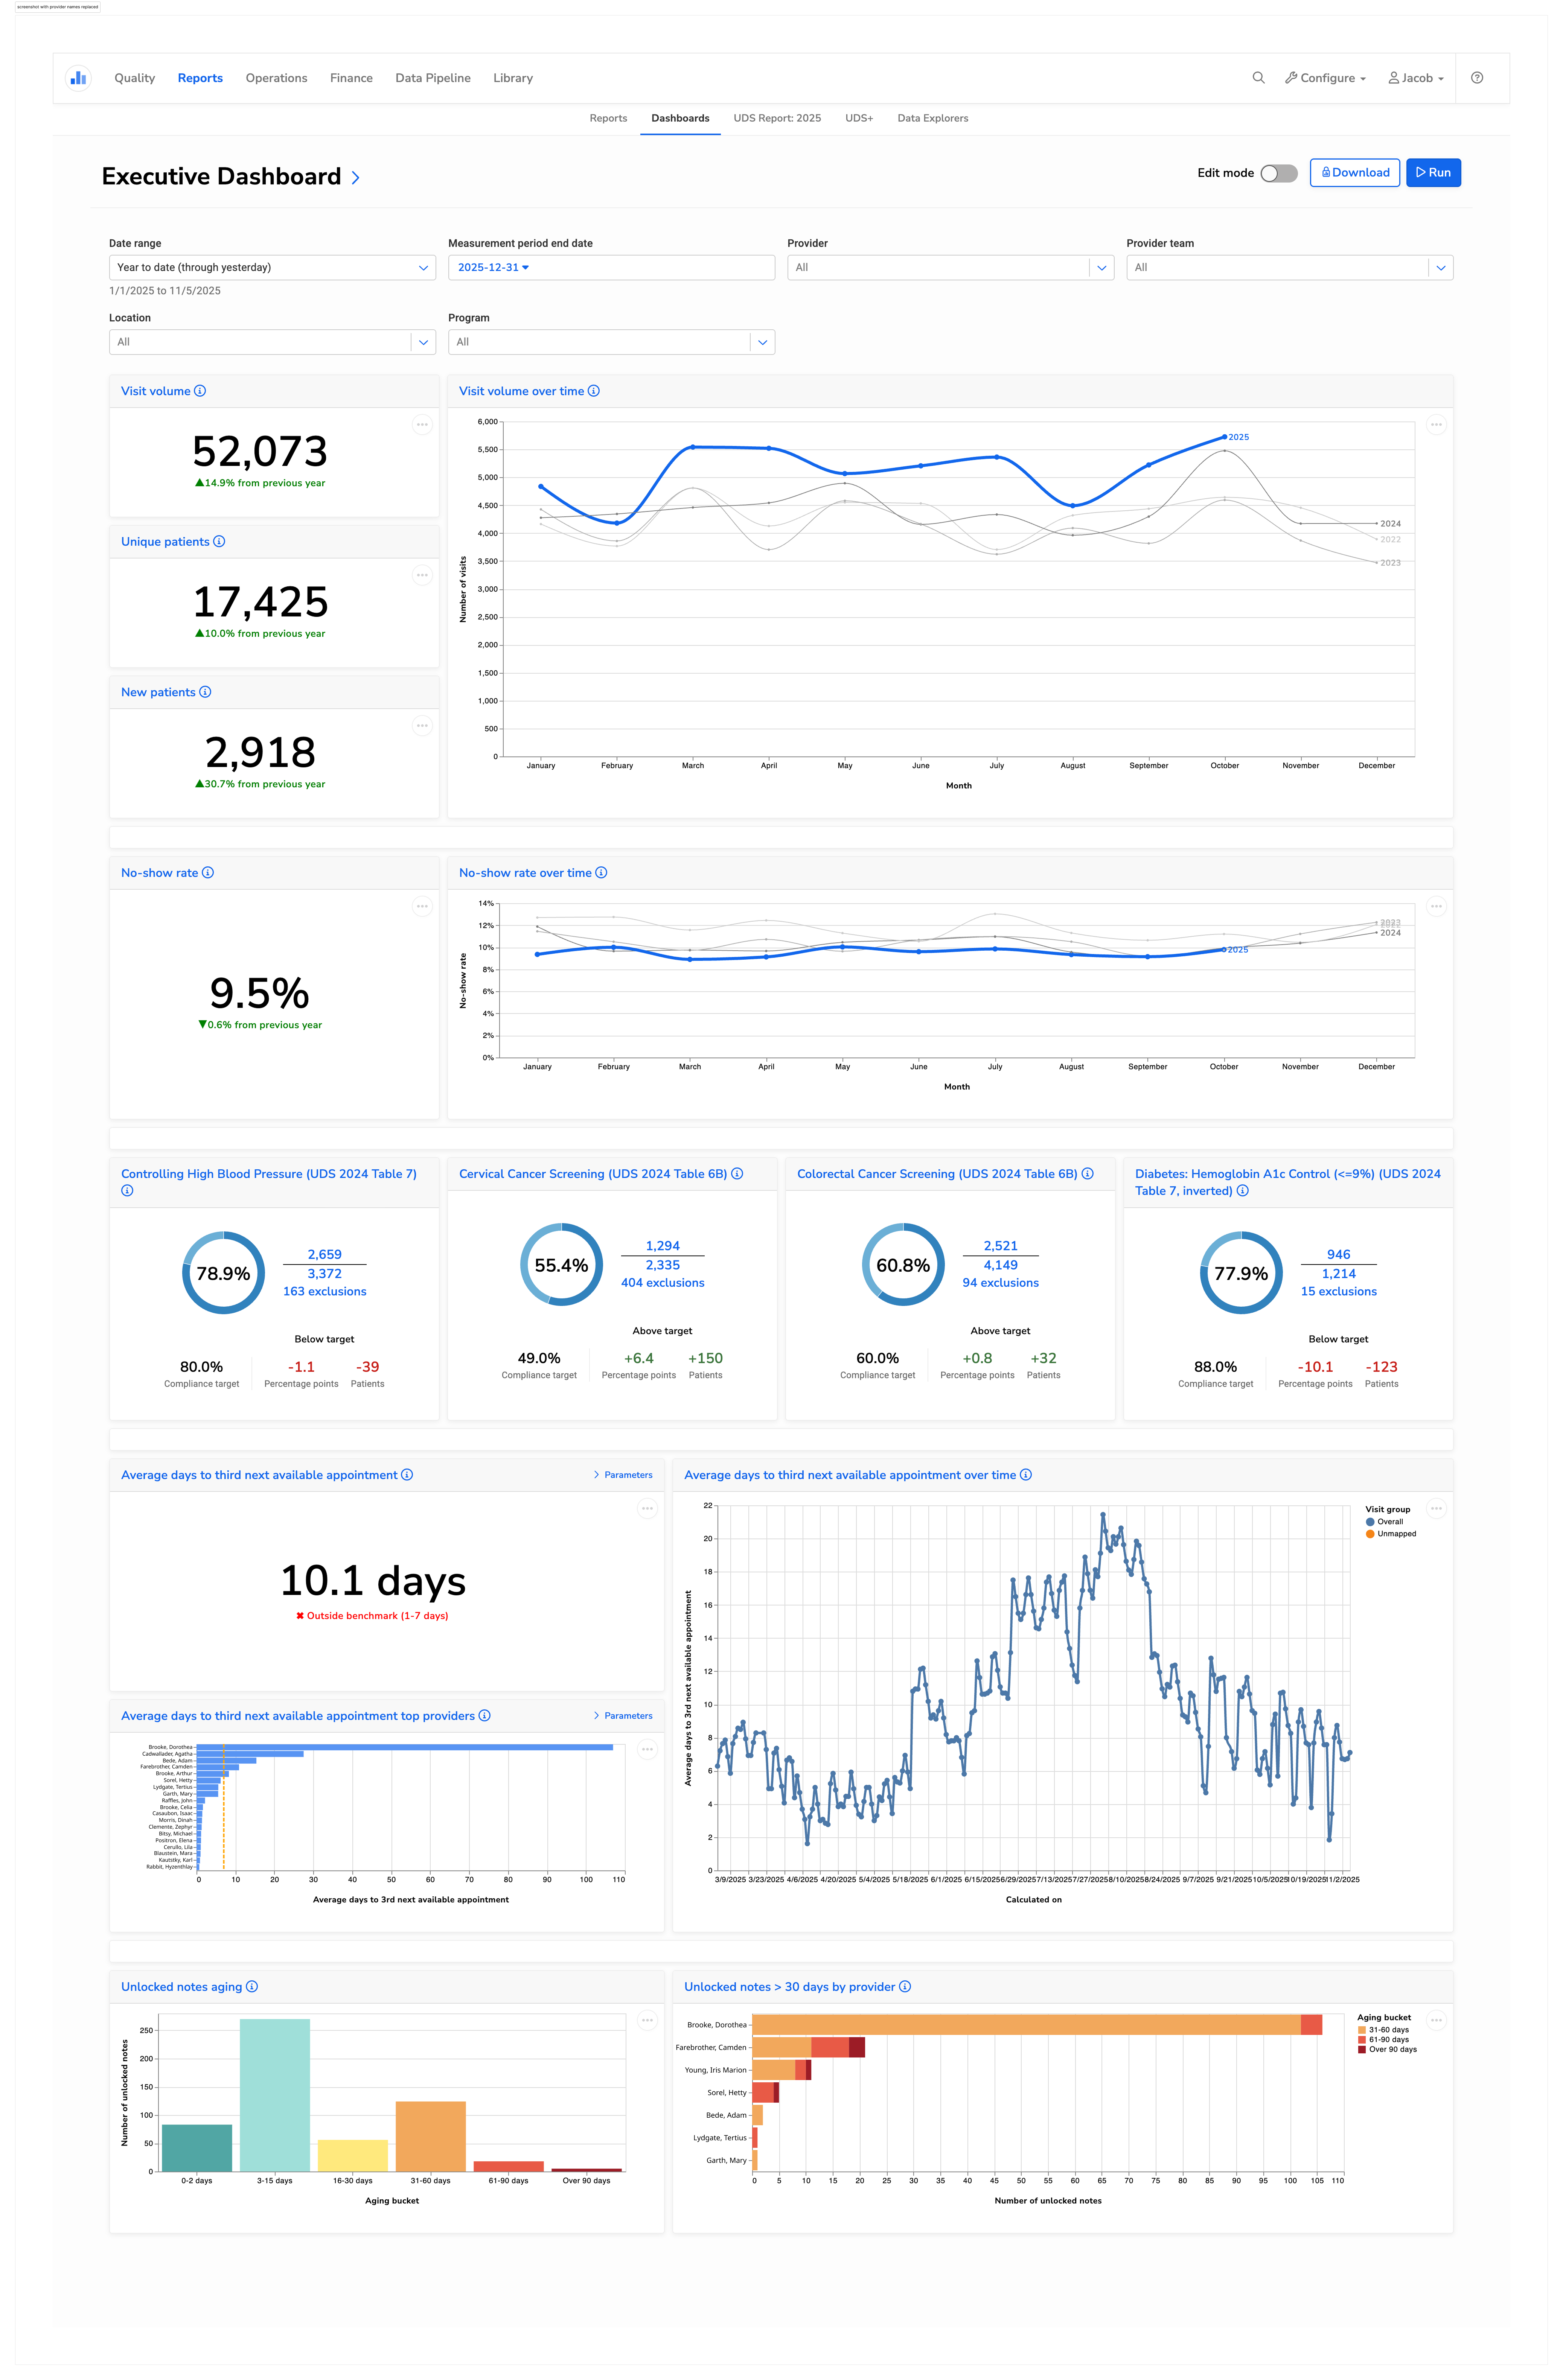
Visit and patient volume
Visit and patient volume provide insight into productivity, utilization, and patient access. Understanding the trend lines for these numbers allows for both operational planning and financial forecasting. Sudden drops may signal scheduling issues, staffing shortages, or access barriers, while growth can indicate the need for expanded capacity.
No-show rates
No-show rates impact nearly every aspect of a health center’s performance, including:
Operational efficiency. No-shows disrupt workflows and waste valuable clinical time.
Patient care and outcomes. Patients who miss appointments often have poorer health outcomes. Monitoring no-shows allows health centers to identify patients who may be struggling with access barriers—such as transportation issues, financial hardship, or misunderstanding instructions—and intervene early.
Financial performance. No-shows often mean lost revenue for the health center. High no-show rates reduce the number of billable visits, while increasing per-visit cost (since overhead remains constant while patient volume decreases).
After identifying patterns in no-show data, health centers can test a variety of interventions to reduce no-show rates, including appointment reminders, telehealth options, or patient transportation programs. In addition, health centers may begin double-booking certain appointment slots.
Quality measures
Health centers that are most effective at improving patient outcomes typically choose a small set of clinical quality measures as a focus for organization-wide improvement. Highlighting these metrics on an executive dashboard keeps them front and center for leadership.
Once priorities are set, clinical teams can take specific steps to close care gaps and monitor progress. Read more about how Petaluma Health Center improved clinical outcomes using Relevant.
Third-next available appointment
This metric shows how quickly patients can access care, and how well a health center is managing capacity. It impacts:
Access to care. A long wait time for the third-next slot indicates barriers to access, which can lead to patient dissatisfaction or delayed treatment.
Continuity of care. To be able to see your preferred provider without a long delay supports stronger patient-provider relationships, which lead to better outcomes.
Analyzing this data can identify whether long wait times are a problem across the health center, or for specific providers or visit types. The underlying challenge may be a provider shortage or uneven patient distribution across provider panels.
Why third-next?
Measuring the third-next available appointment reflects true availability better than simply measuring the next available slot, which could be open due to cancellations. To further account for data volatility, our Executive Dashboard presents this data averaged over time.
Unlocked notes
Locking progress notes in a timely manner helps facilitate smooth billing and operational workflows. If a note remains unlocked, a claim can’t be generated and clinical data may be incomplete. Tracking and managing the volume of unlocked notes can reduce revenue cycle delays, decrease legal and compliance exposure, and improve clinical data integrity.