Visualizing and filtering measure results
Clicking on a measure from an overview screen allows for further exploration of measure results.
Compliance overview
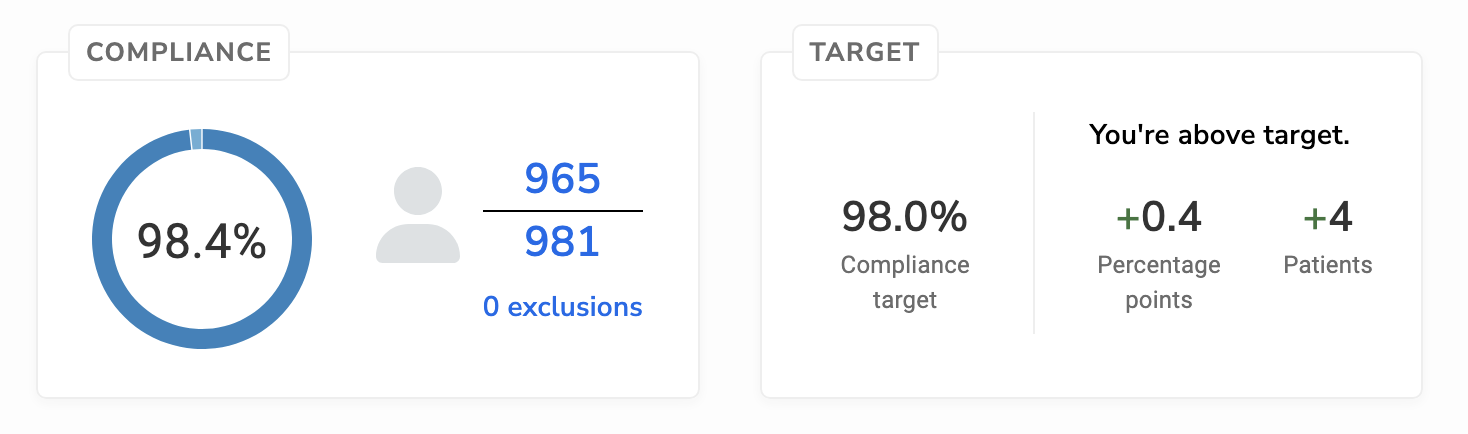
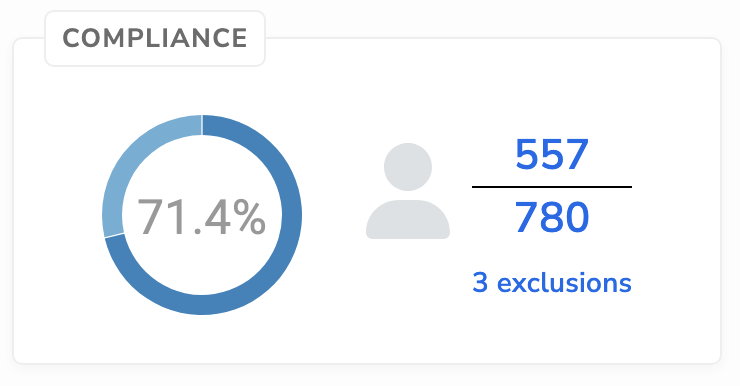
The compliance box provides an overview of the numerator, denominator, exclusions, and compliance for the current measurement period. Click on the numerator, denominator, or exclusions to obtain detailed measure results for patients in each category.
Compliance trend view
Visualize compliance over past measurement periods. You can also stratify this visualization by patient and health center characteristics.
Numerator and denominator view
You can also view measure result trends by numerator and denominator counts rather than compliance percentage. This can help to explore whether compliance trends are affected by a drop in the numerator or an influx of patients eligible for the denominator.
Filtering
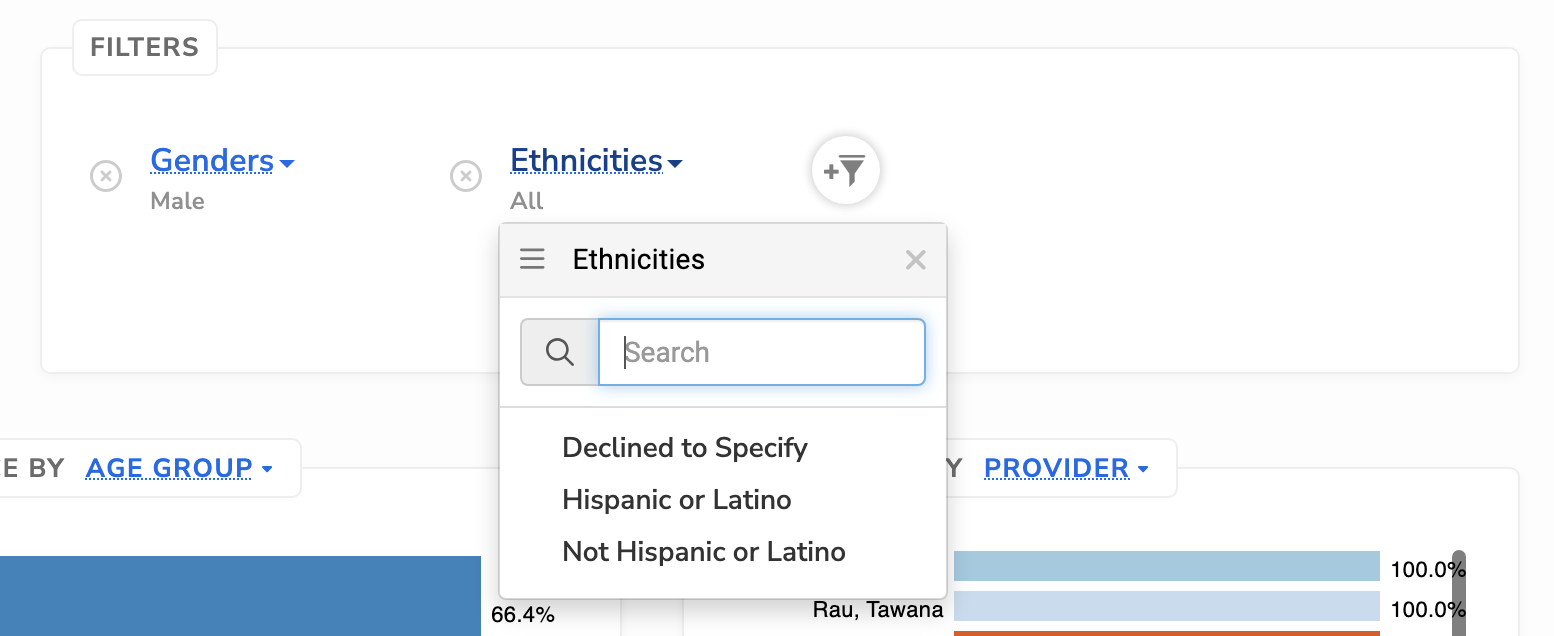
To slice & dice results according to patient and provider characteristics, make selections from the dropdown menus, and then click to filter measure results. For example, maybe you’d like to look at compliance for female patients with Medicaid, or Hispanic patients being seen at your largest location. Results throughout the dashboard will dynamically update as you click.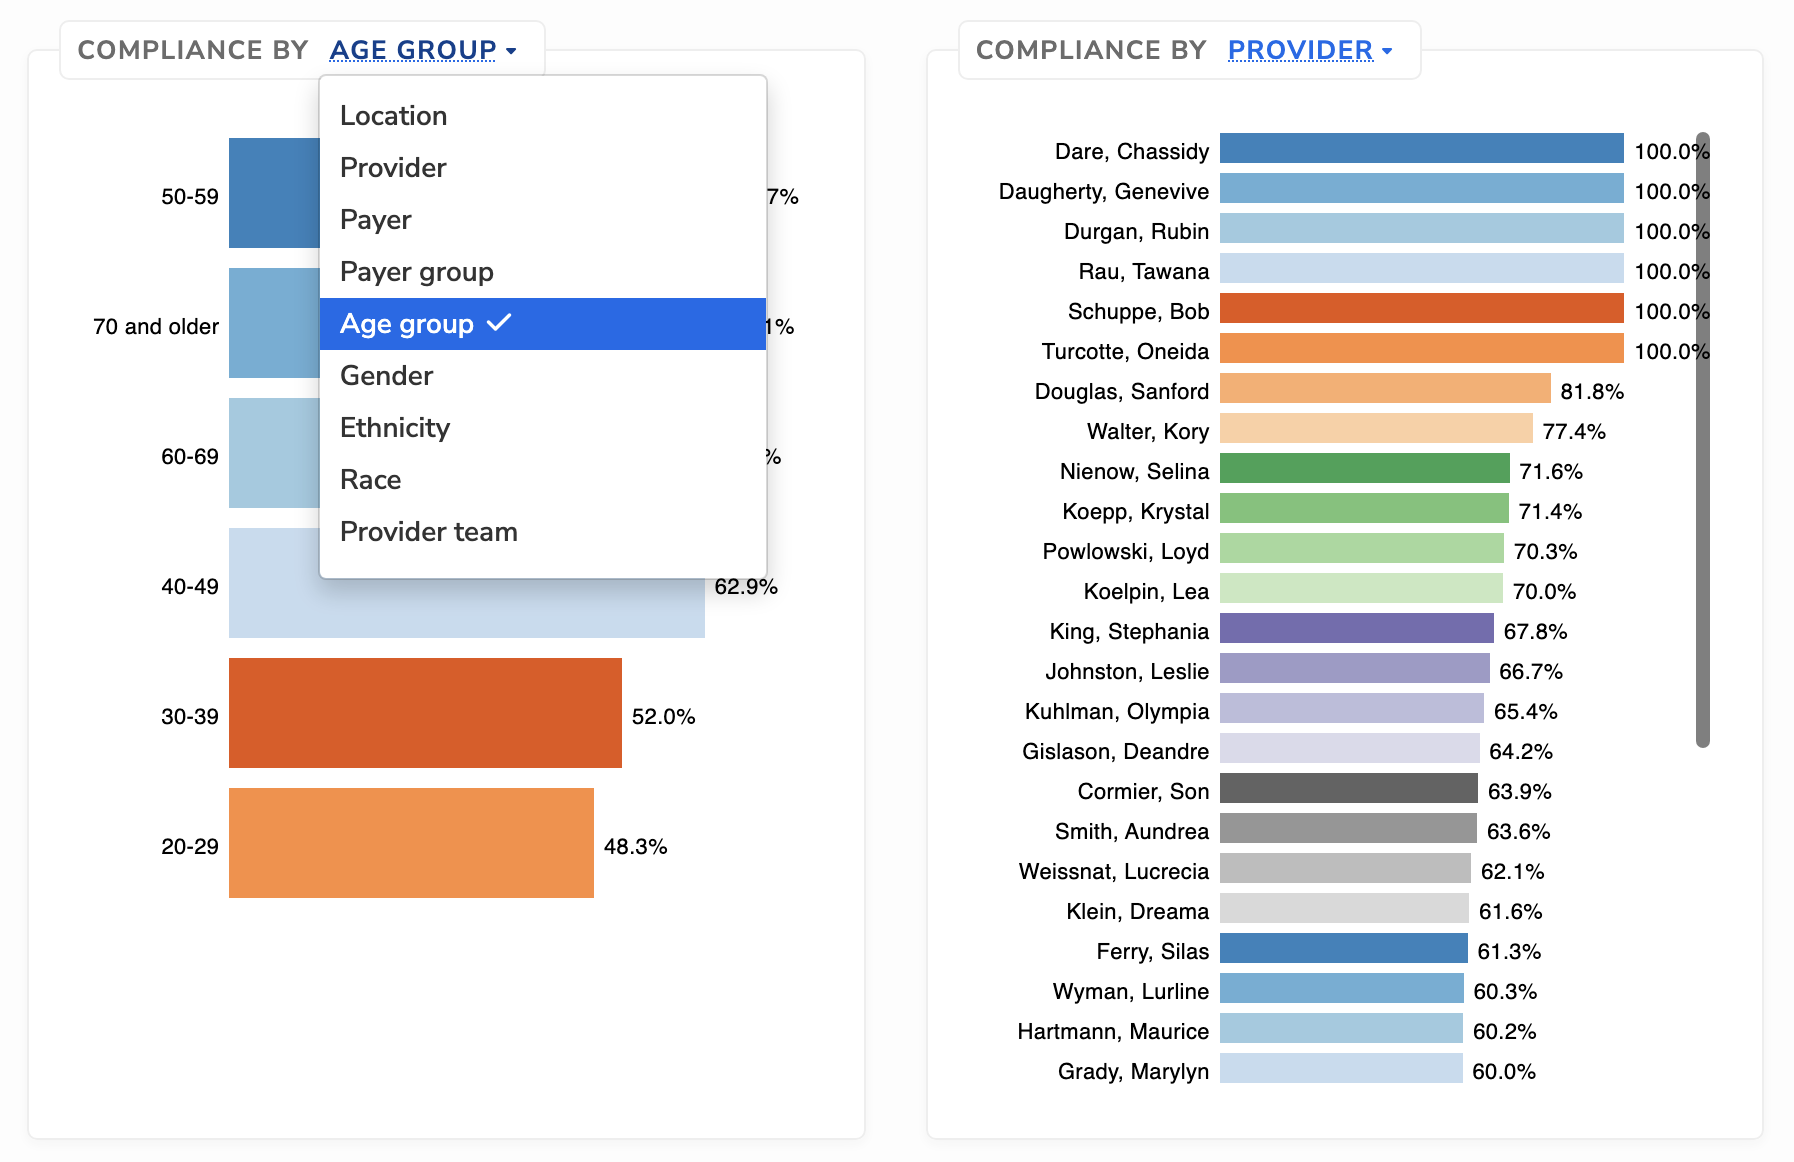
The Filters box supports more complex filtering (and keeping track of what you’ve already selected).
Measure targets
Set compliance goals by using target percentages. The target box will display your progress towards your goal and will be displayed in the trend chart. Target percentages can be set in the individual Measure screen in the Data Pipeline.