Using denominator minimums to clean visualizations
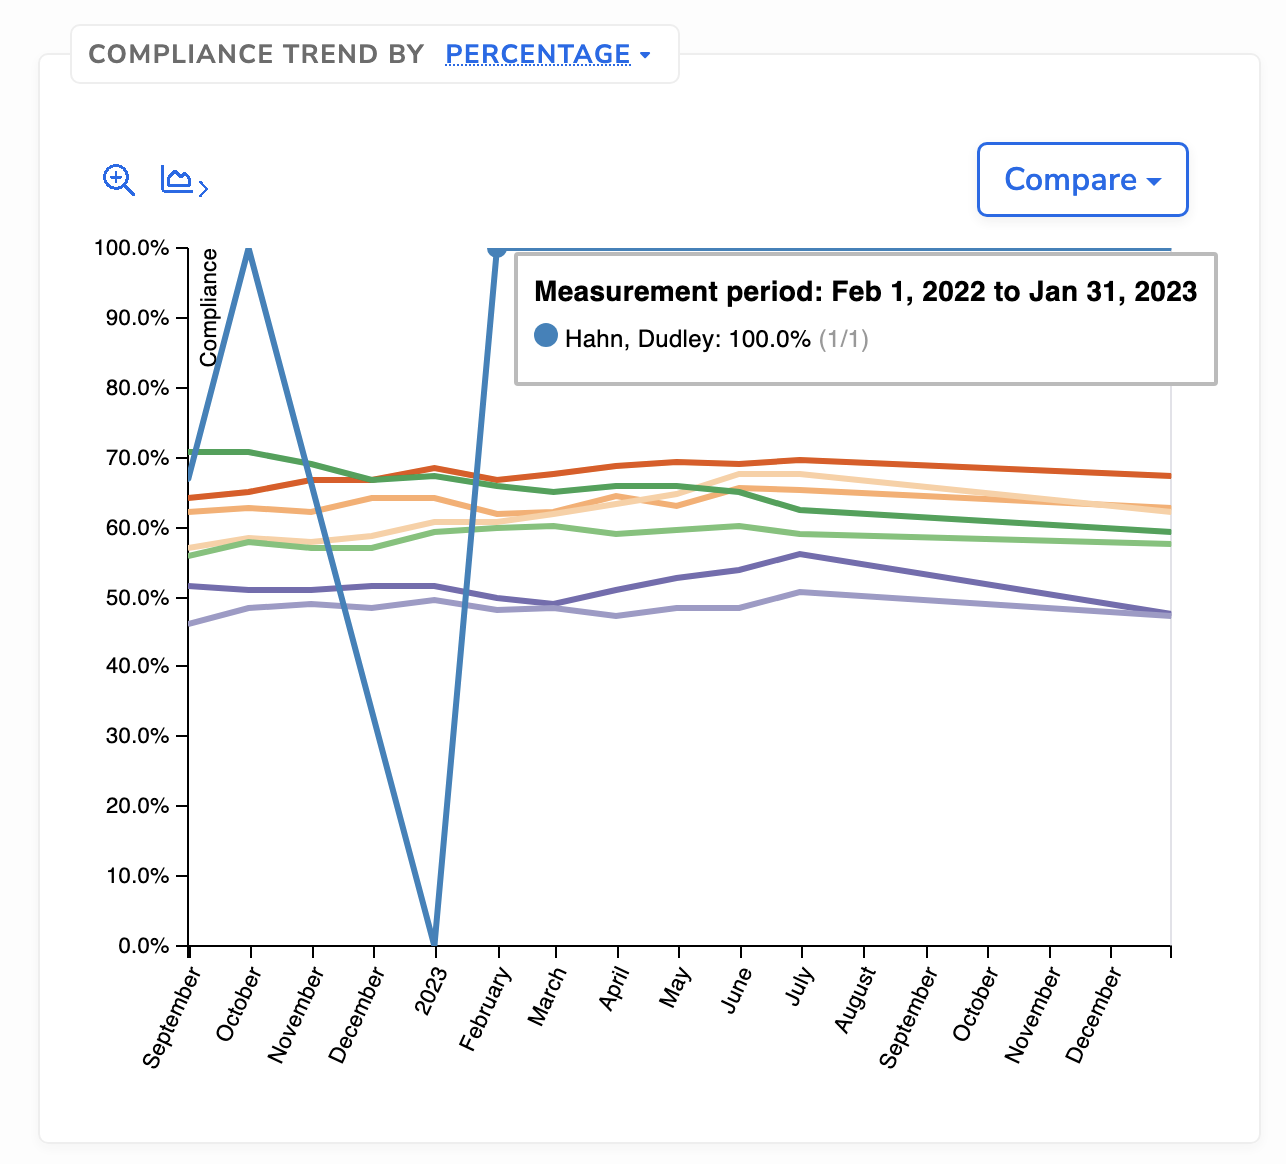
Measure results, especially when filtered or stratified, may look misleading due to small denominator sizes. In the example below, the provider only saw one patient, so the trend line isn’t very useful:
To clean up visualizations, expand the header and enter in a minimum denominator size:
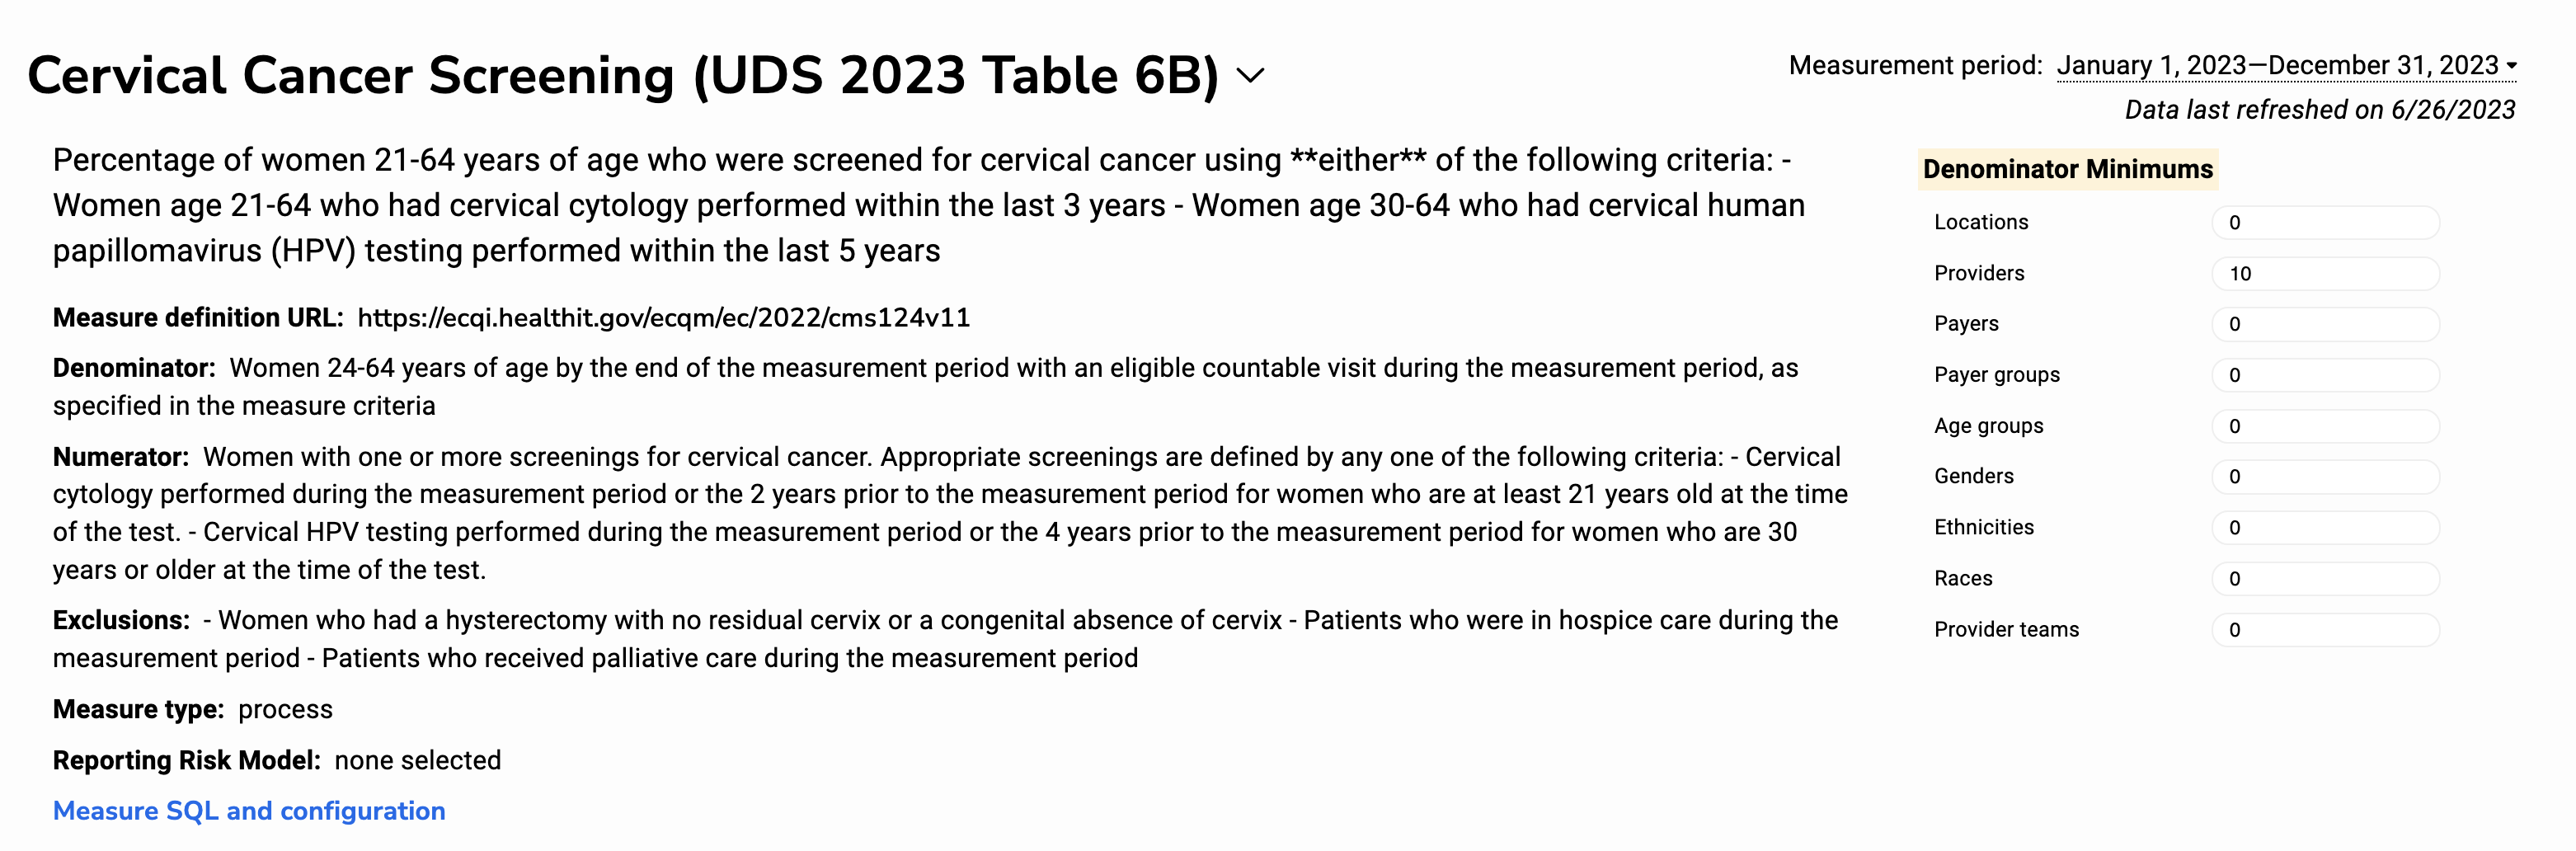
Here, only providers with more than 10 patients in the denominator will be displayed, hiding any trend lines that do not meet this threshold. Note that these patients are not filtered out from the overall measure results.