Reviewing an individual measure
A Quality Measure is organized into several sections on the same page, helping you understand current performance, trends over time, and what factors are driving change.
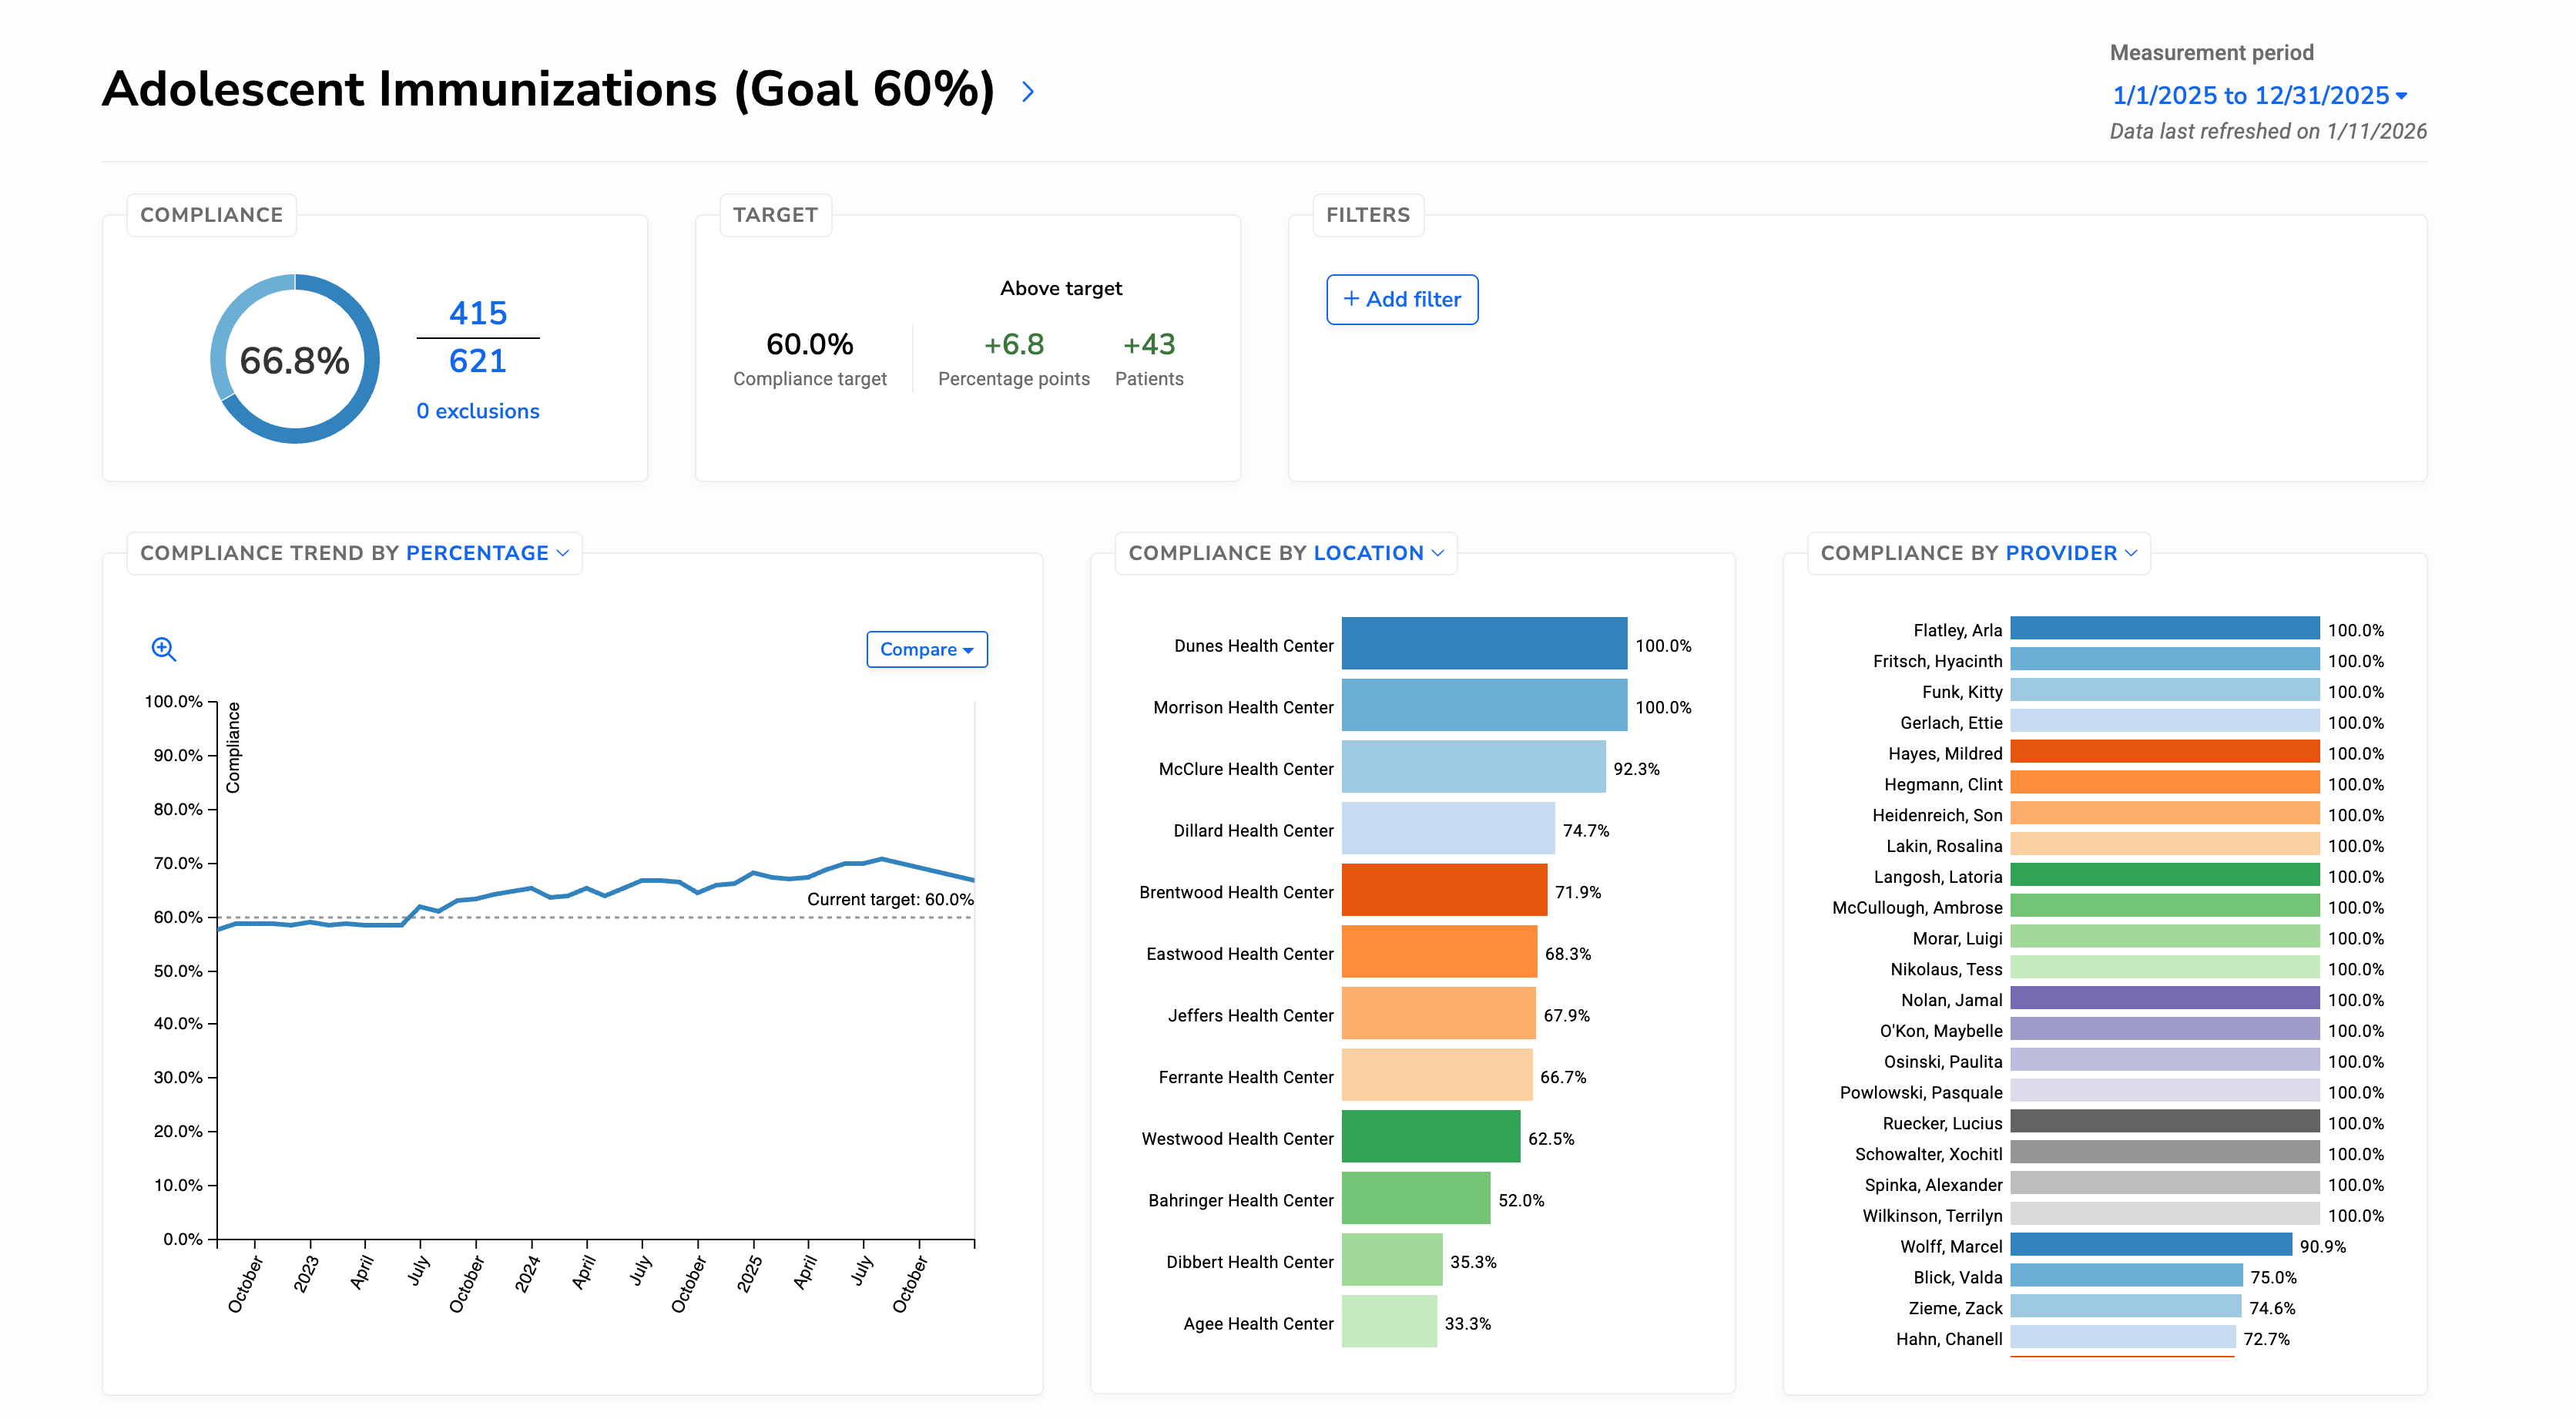
Reviewing current performance
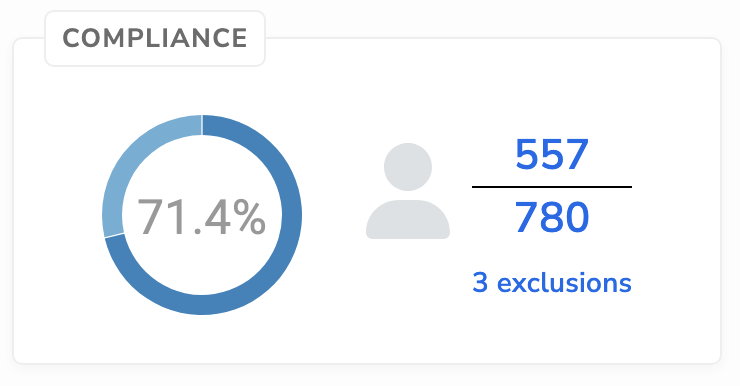
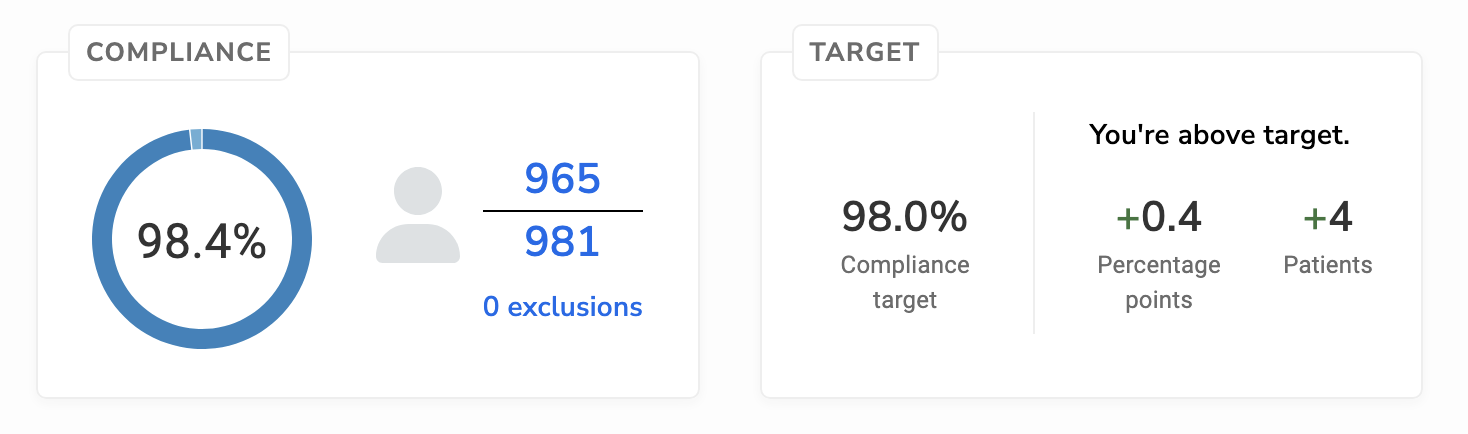
The compliance summary provides an overview of how the measure is performing for the selected measurement period, including:
- Overall compliance percentage
- Numerator
- Denominator
- Exclusions
From this section, you can review patient-level results for each category by selecting the numerator, denominator, or exclusions, and explore the underlying data using the measure results timeline.
Using measure targets
Some measures include target percentages that provide context for evaluating performance. When targets are set, they appear alongside results and in trend sections to show progress toward the goal.
Targets can help support monitoring and improvement efforts, especially when reviewing performance over time.
Note: Measure targets are configured in the Data Pipeline.
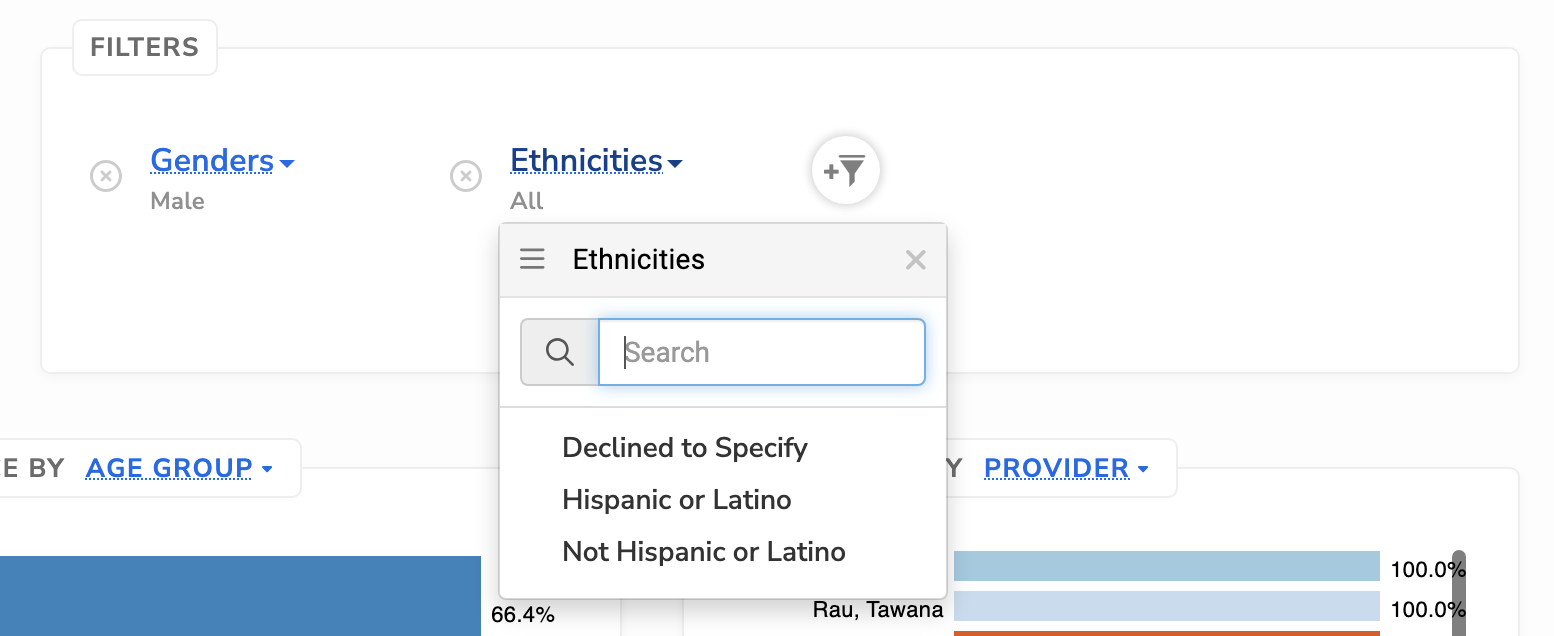
Filtering measure results
Filters allow you to narrow measure results by patient, provider, and location characteristics. When filters are applied, all results on the page update to reflect only the selected population.
Filtering is useful when you want to:
- Compare performance across locations or providers
- Review results for specific patient populations
- Investigate differences in performance between groups
The filters panel shows which filters are currently applied, helping you understand how results are scoped.
Understanding trends over time
The trend section shows how measure performance changes across measurement periods.
You can review:
-
Compliance trends, which display performance as a percentage over time
-
Numerator and denominator trends, which show how patient counts change over time
Reviewing numerator and denominator counts alongside compliance can help explain changes in performance. For example, a decline in compliance may reflect an increase in eligible patients rather than fewer patients meeting the measure criteria.
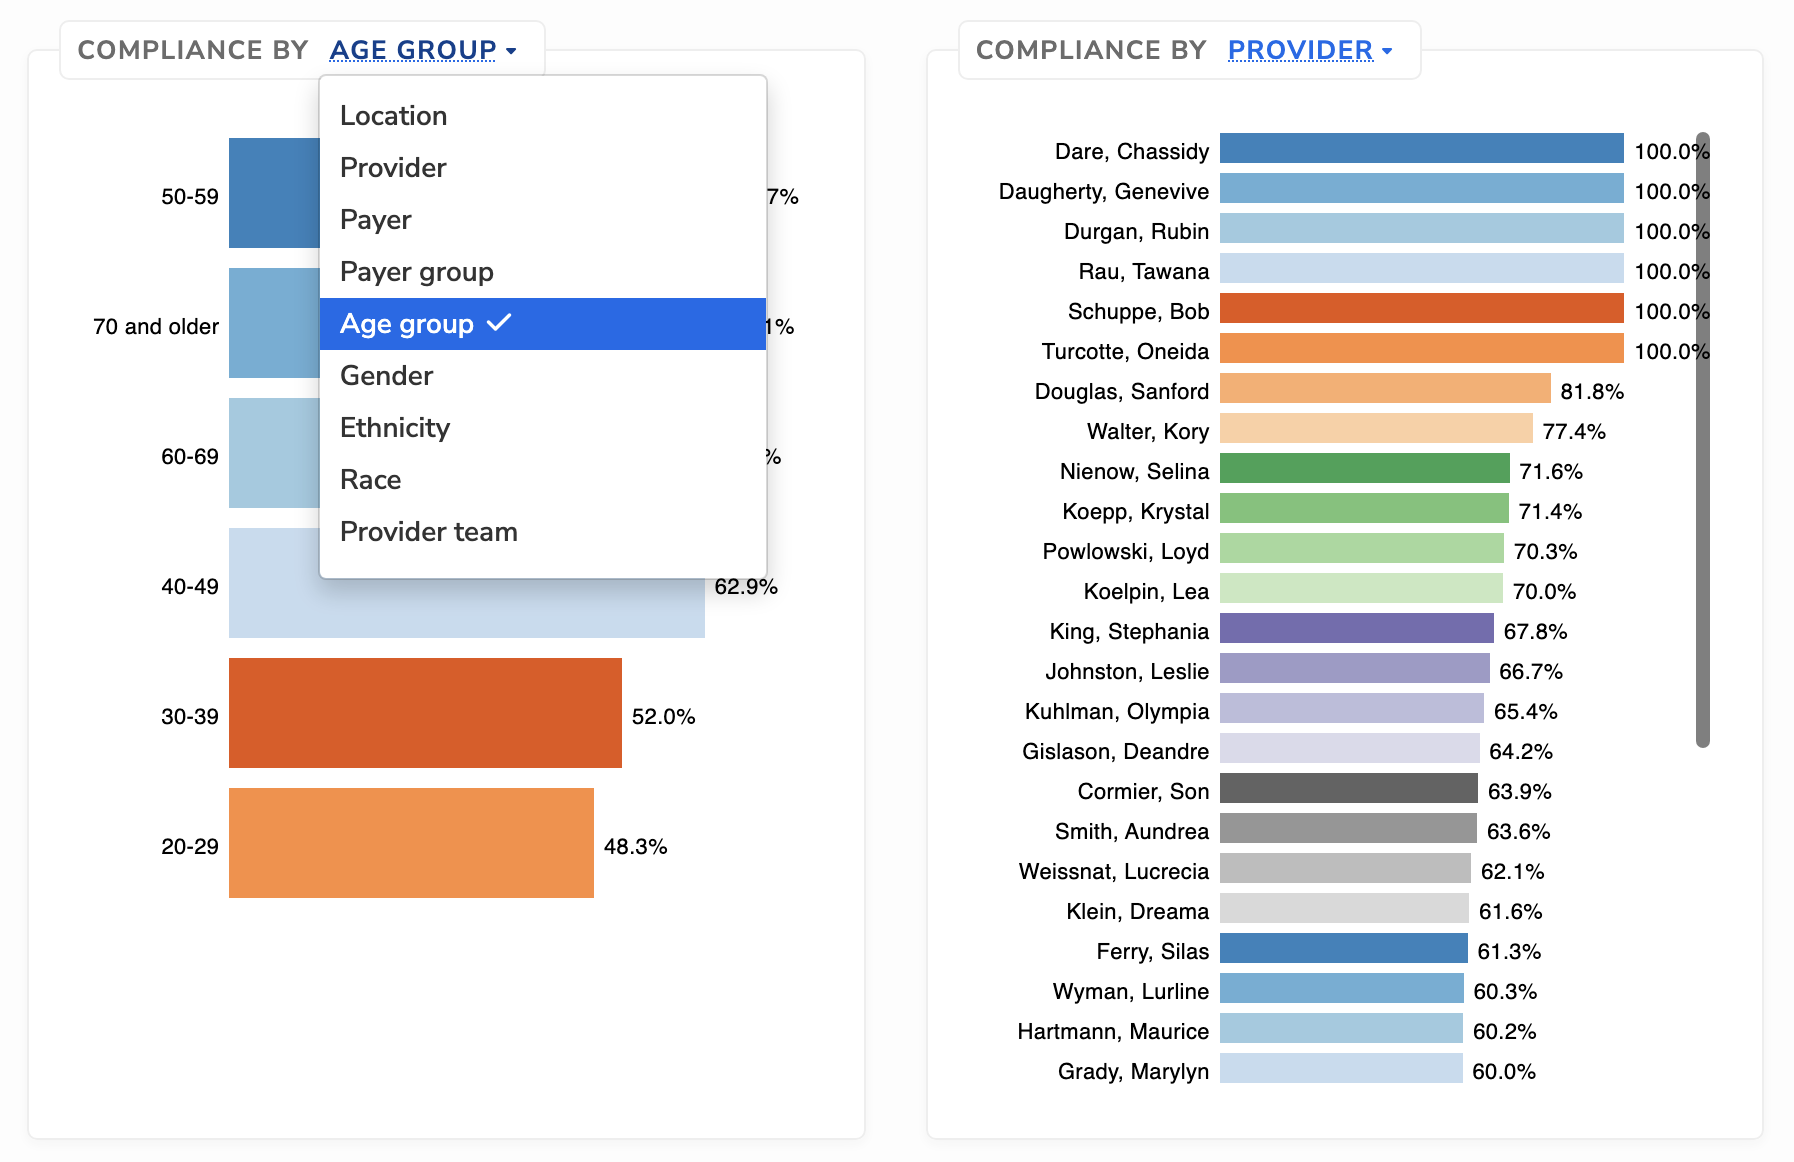
Exploring your data with bar charts
Bar charts break down measure results by key dimensions such as location, provider, and patient characteristics. They help you quickly see where performance differs across groups.
These charts are useful when you want to:
- Compare performance across locations or providers
- Identify populations driving overall results
- See compliance percentage for a specific item within a dimension
Selecting a bar updates the rest of the page to focus on that subset of patients, including the compliance summary, trends, and applied filters. This makes it easier to move from high-level patterns to more detailed analysis without leaving the measure page.